
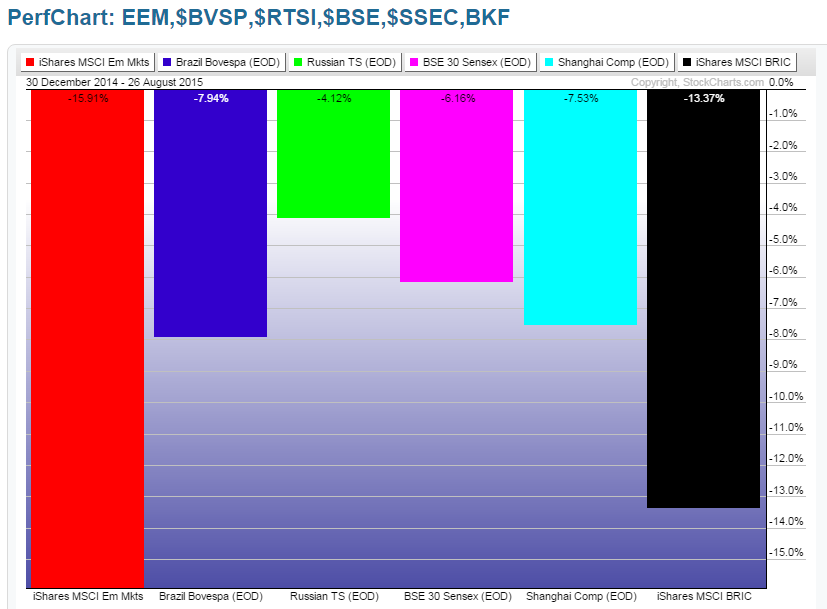
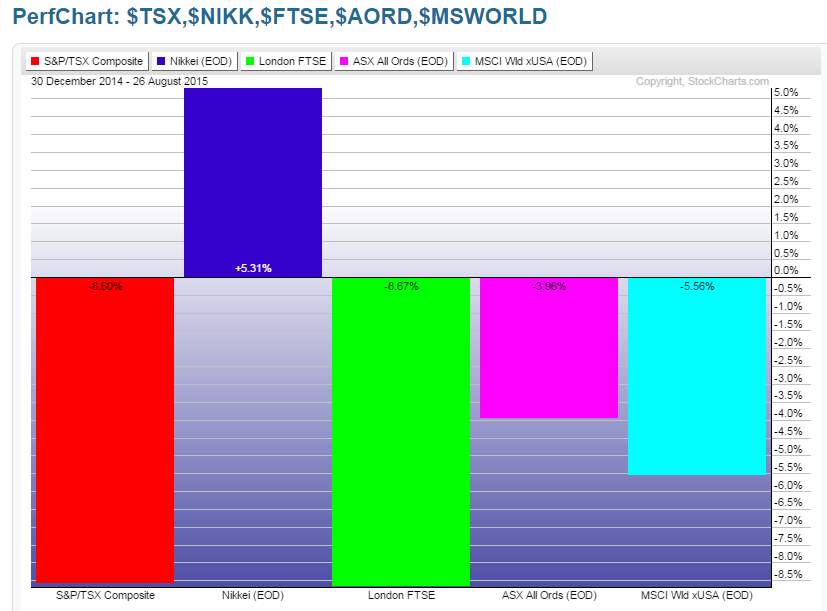
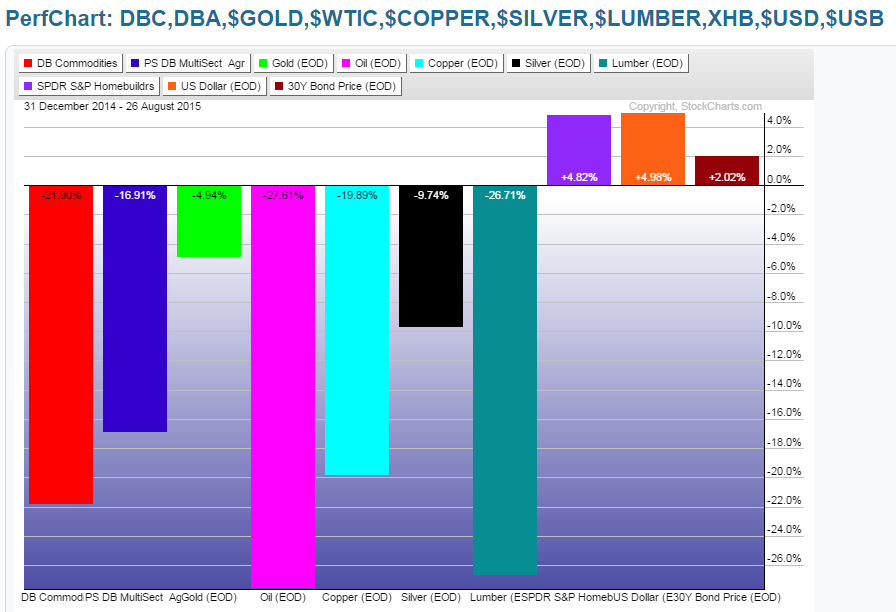
After the market pullback that we’ve seen, of late, I thought I’d simply post the following Year-to-Date percentage-gained/lost graphs of a variety of world markets, to illustrate (at a glance) which ones are still “up” on the year (as of their close on Wednesday, August 26th)…presented without individual comment.
They can be monitored to see if they strengthen or weaken over the coming days/weeks, as a possible gauge of general sentiment for the remainder of the markets, particularly, those markets that have lost the most ground this year.
 |
|
U.S. Major Indices |
 |
|
U.S. 9 Major Sectors |
 |
|
Germany, France + PIIGS Countries |
 |
|
Emerging Markets ETF + BRIC Countries + BRIC ETF |
 |
|
Canada, Japan, UK, Australia + World Market Index |
 |
|
Commodities, Homebuilders ETF, U.S. $ + U.S. Bonds |
 |
|
Currencies |
