
Apologies for the missing and late update so far this week. The bug I caught last week is taking longer to shift than I expected. Hopefully it should be gone by the end of the week.
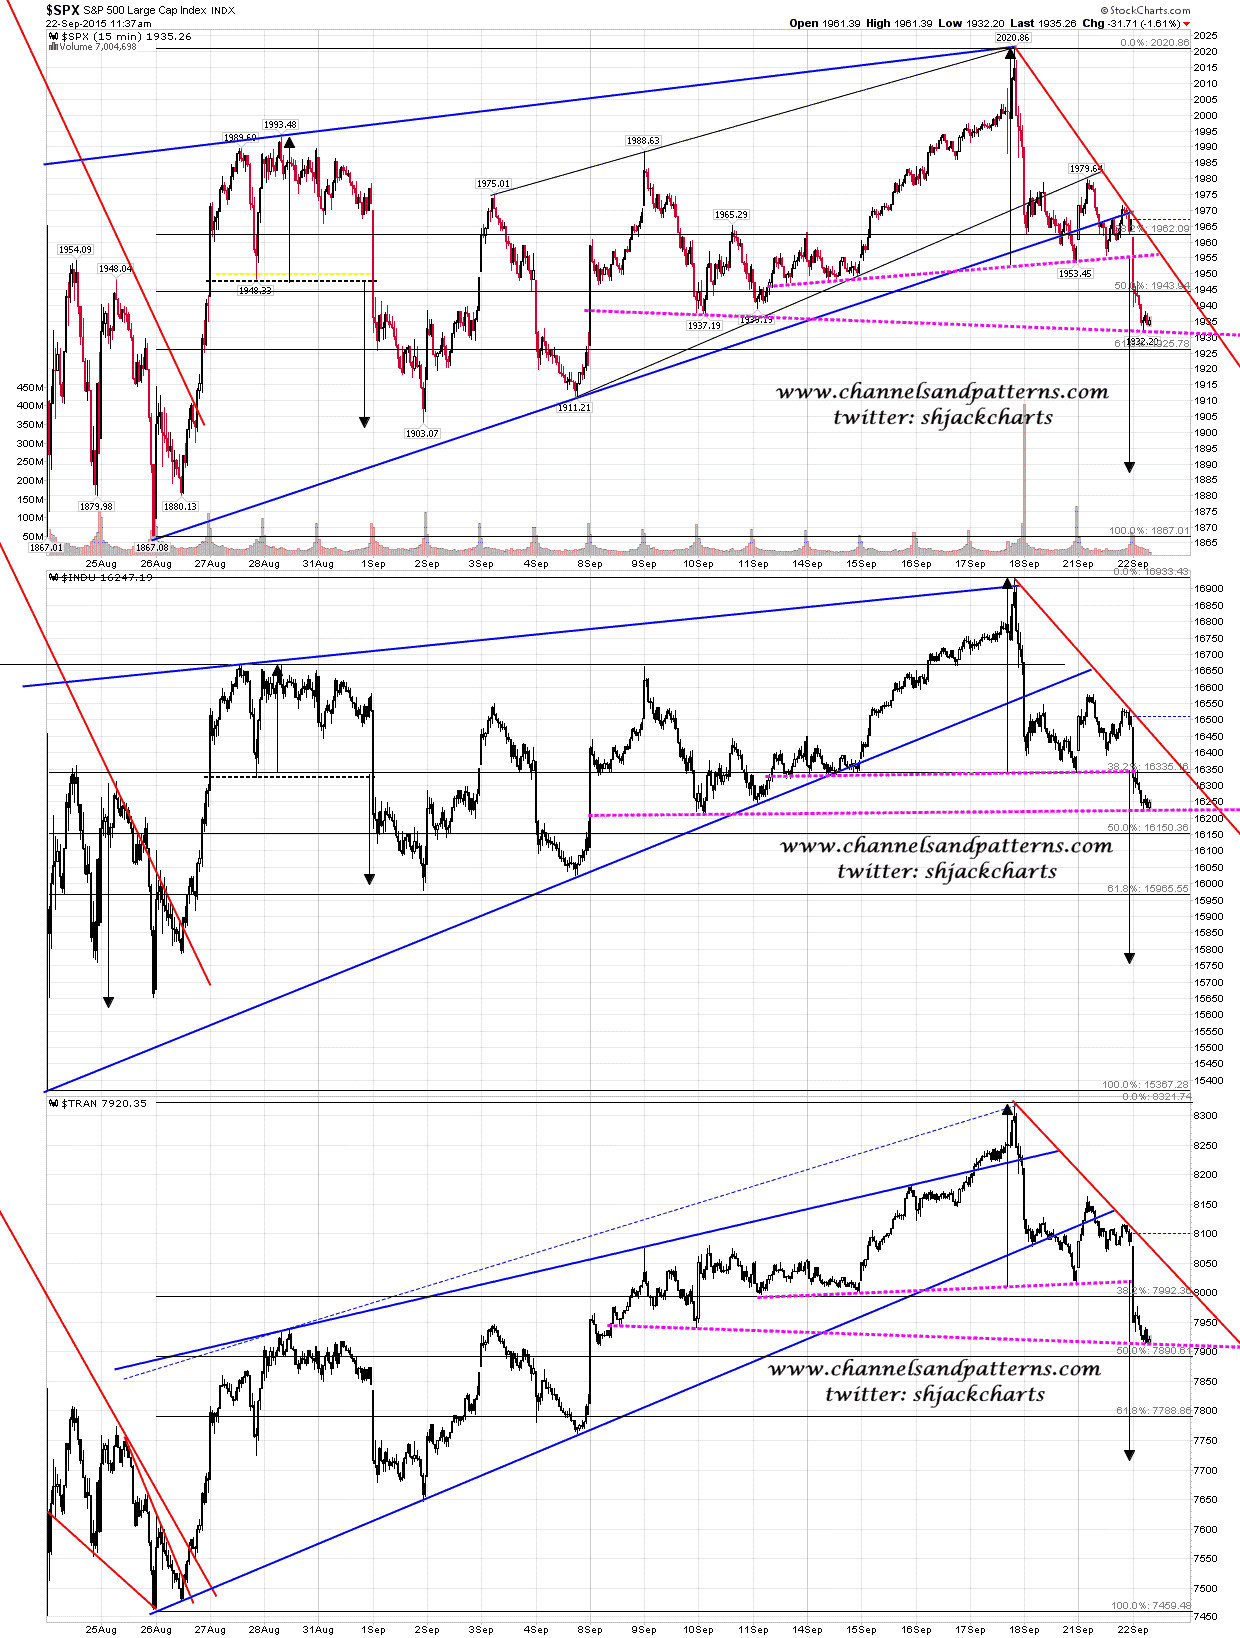
So where are we up to on SPX here? Well the big gap down this morning has taken out daily middle band support, and the small flag I posted yesterday has broken down with a target in the 1912 area. I’ve drawn in the likely H&S patterns that have formed on SPX, Dow and TRAN and if these are right then all of these are on their way to retest the panic lows. I have drawn in possible alternate necklines on a bounce from the AM low today, but I’m not expecting right shoulders to form on those. Just a possibility to consider. Scan 3x 15min SPX INDU TRAN charts:
On the bigger picture the Fed high has established a perfect falling channel from the highs and now that SPX daily middle band support has broken the way is clear to retest the 1867 low. As long as this channel holds SPX may go a lot lower. The rising wedge that has formed over the last few weeks is a bear flag on the bigger picture, and the flag has two alternate targets. The first target is a retest of 1867 or a marginal new low. That option would generally make the second low of a double bottom that would in this case then target a retest of the all time highs. The more likely option in my view is the second option, with this move being a rough match with the flagpole move. That would give a target in the 1784 area, though as I said, these flag targets are rough targets. SPX daily chart:
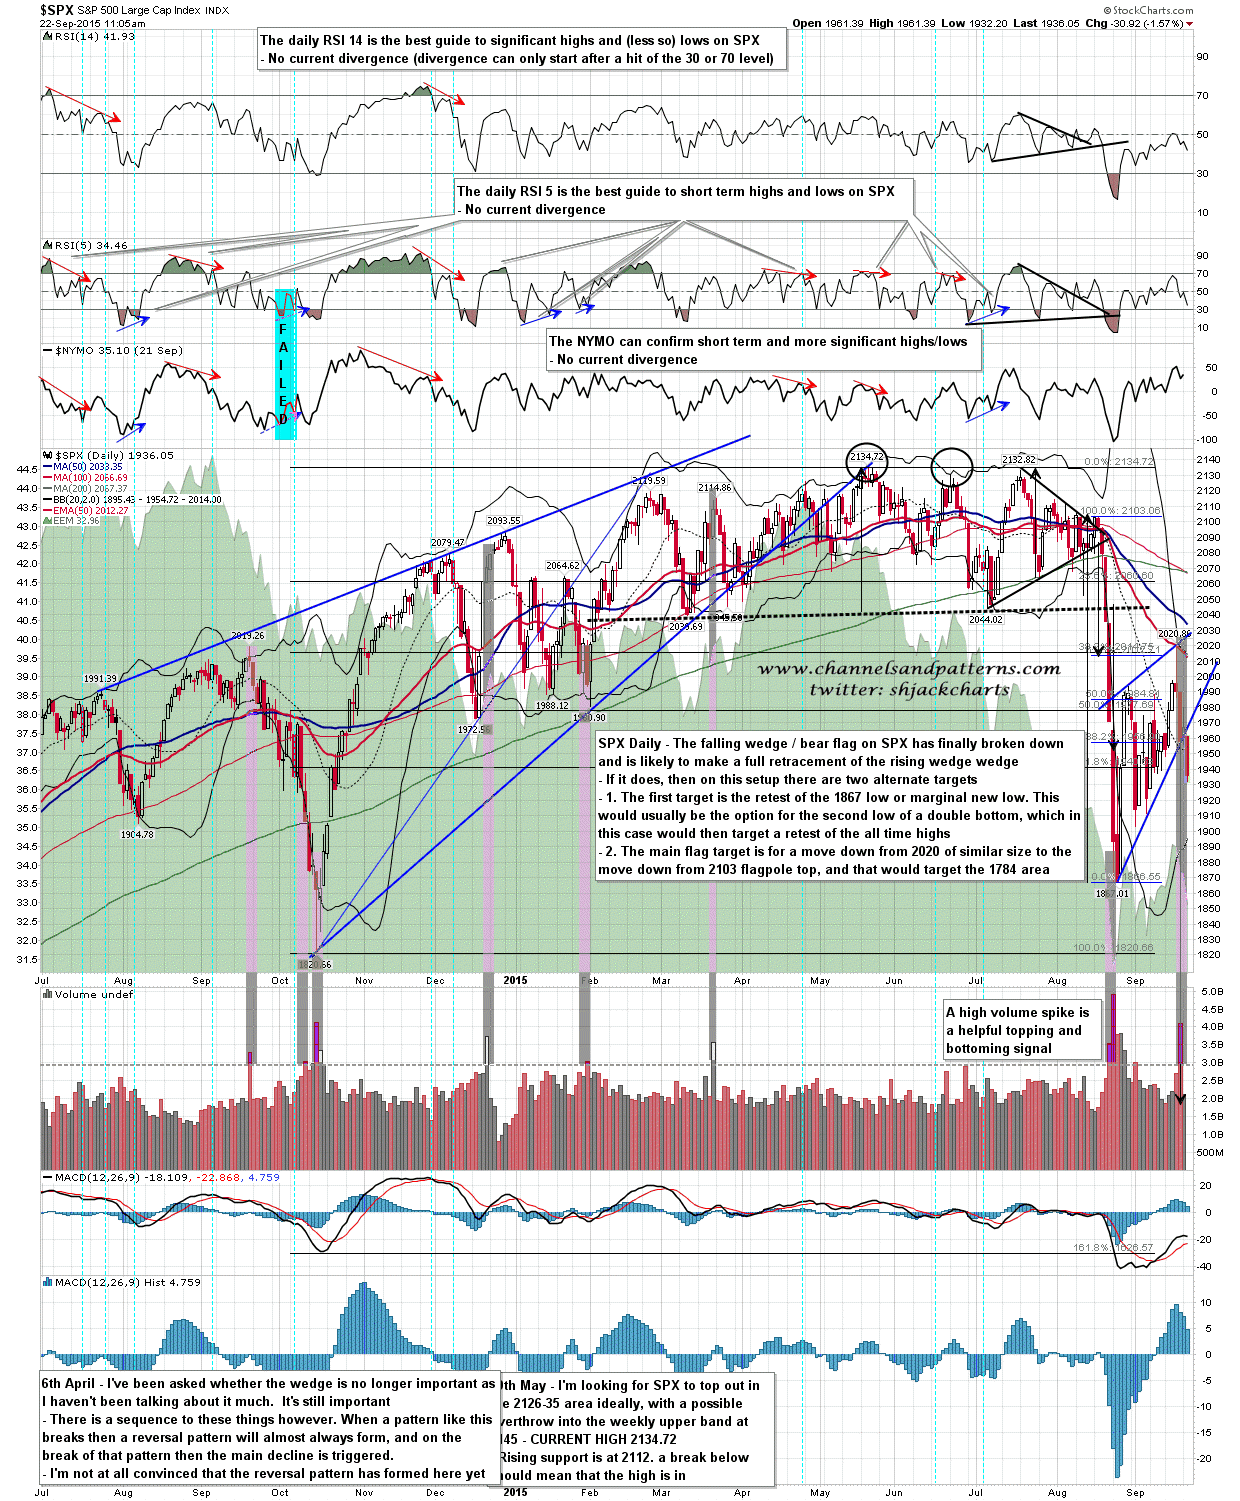
I’m looking for a strong move down here. Yesterday’s flag target is at 1912, the daily lower band is in the 1895-1900 area, the retest of the panic low is at 1867, and the monthly lower band is in the 1840 area. In the event we see a bounce here the daily middle band at 1954 should now be strong resistance.
