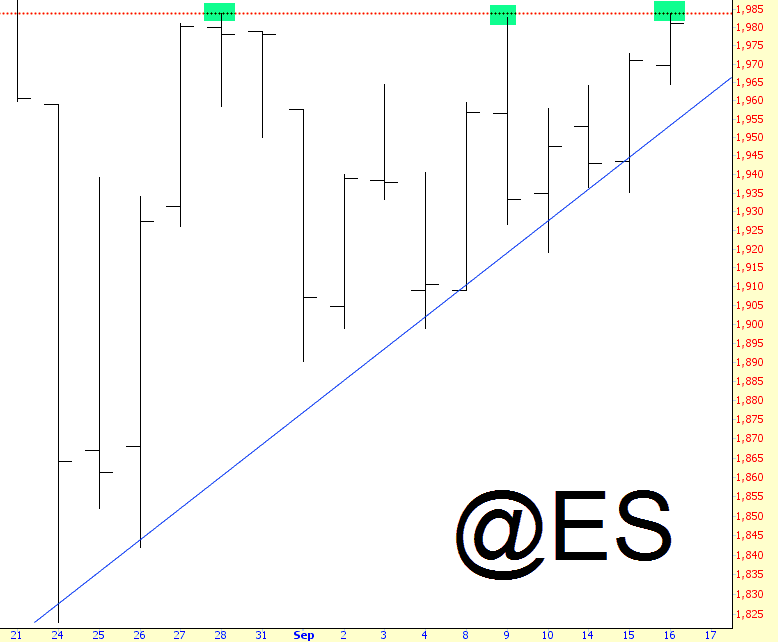
We’ll see if it holds, but for the third time in the past few weeks, the ES has been turned away (this time, at precisely to-the-penny level) from the red resistance line.
Slope initially began as a blog, so this is where most of the website’s content resides. Here we have tens of thousands of posts dating back over a decade. These are listed in reverse chronological order. Click on any category icon below to see posts tagged with that particular subject, or click on a word in the category cloud on the right side of the screen for more specific choices.
We’ll see if it holds, but for the third time in the past few weeks, the ES has been turned away (this time, at precisely to-the-penny level) from the red resistance line.
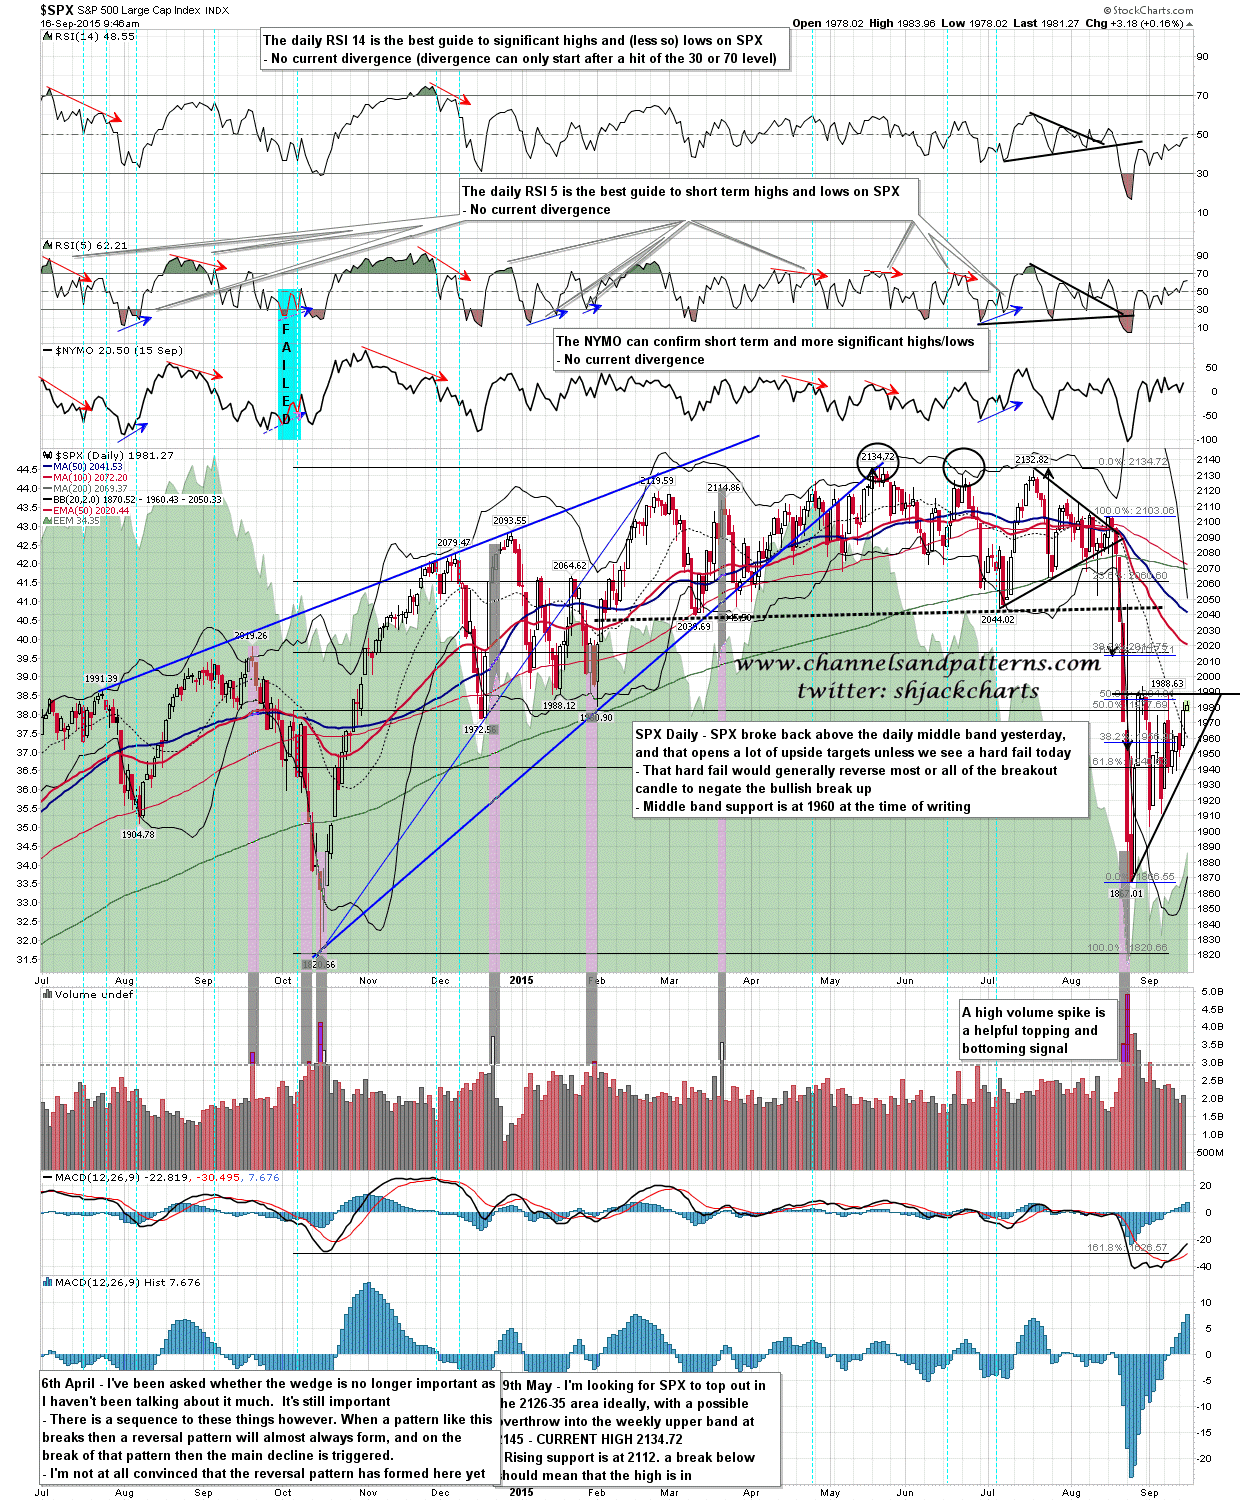
The bulls had an excellent day yesterday and broke back over the daily middle band. This opens up the upside on a further break over 1988-93 resistance, unless we see a rejection candle today that breaks back under the daily middle band. This would be a rejection candle and would normally reverse most or all of yesterday’s breakout candle. The daily middle band is at 1960 at the start of today. SPX daily chart:
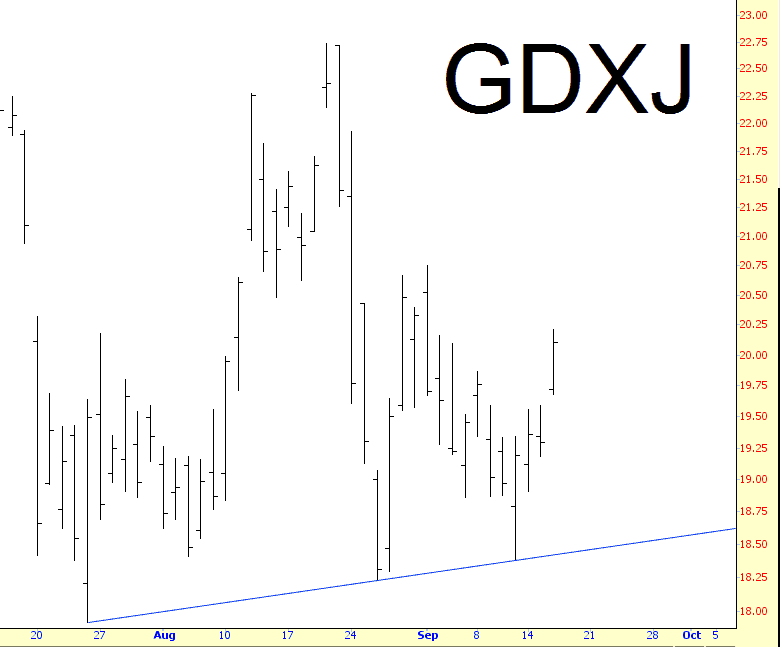
I’m not sure where SHJ is this morning, so I’ll do just a quick comment cleaner. I pointed out on my Tastytrade show yesterday that gold and miners were finally starting to show the potential for strength. Juniors in particular had a nice series of higher lows. That observation seems to be panning out so far this morning, with a 4%+ rise at this point.
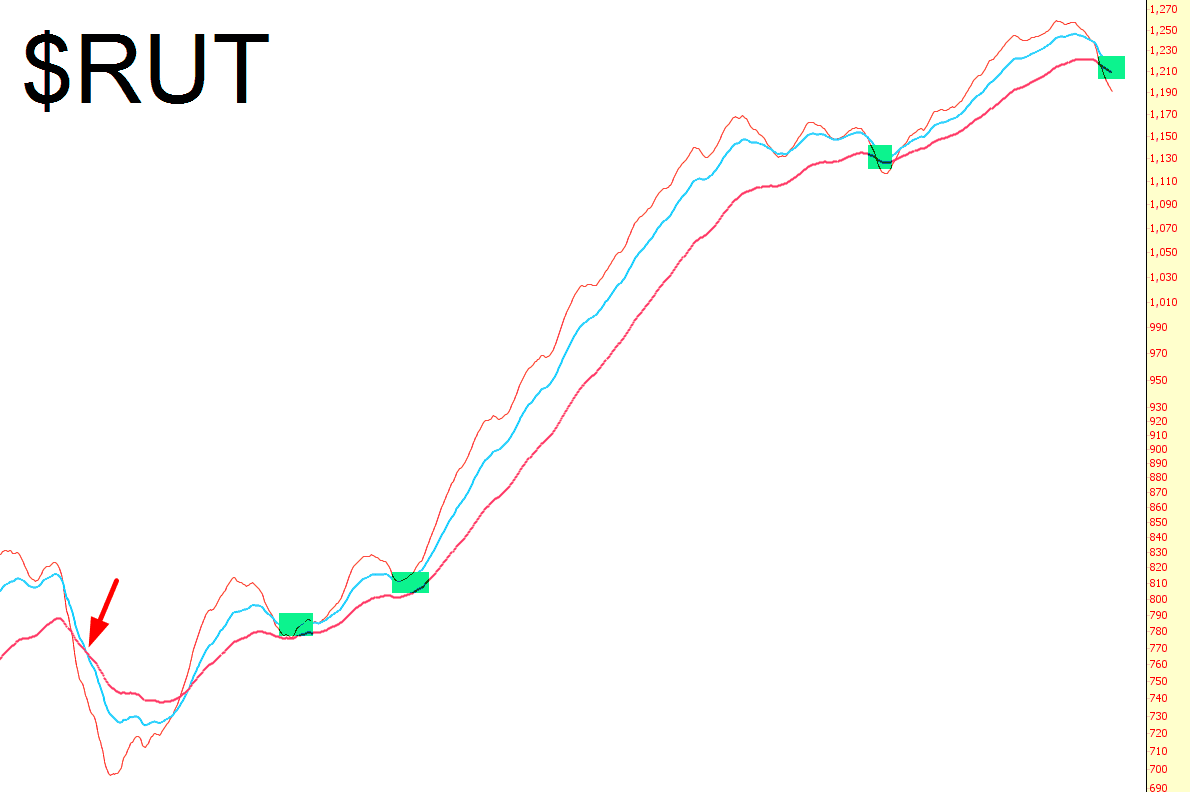
I don’t really use indicators in my trading, but I wanted to take a look at the 50/100/200 day exponential moving average on the Russell 2000. Here’s what I see, and I’ve removed the price data for simplicity and clarity: