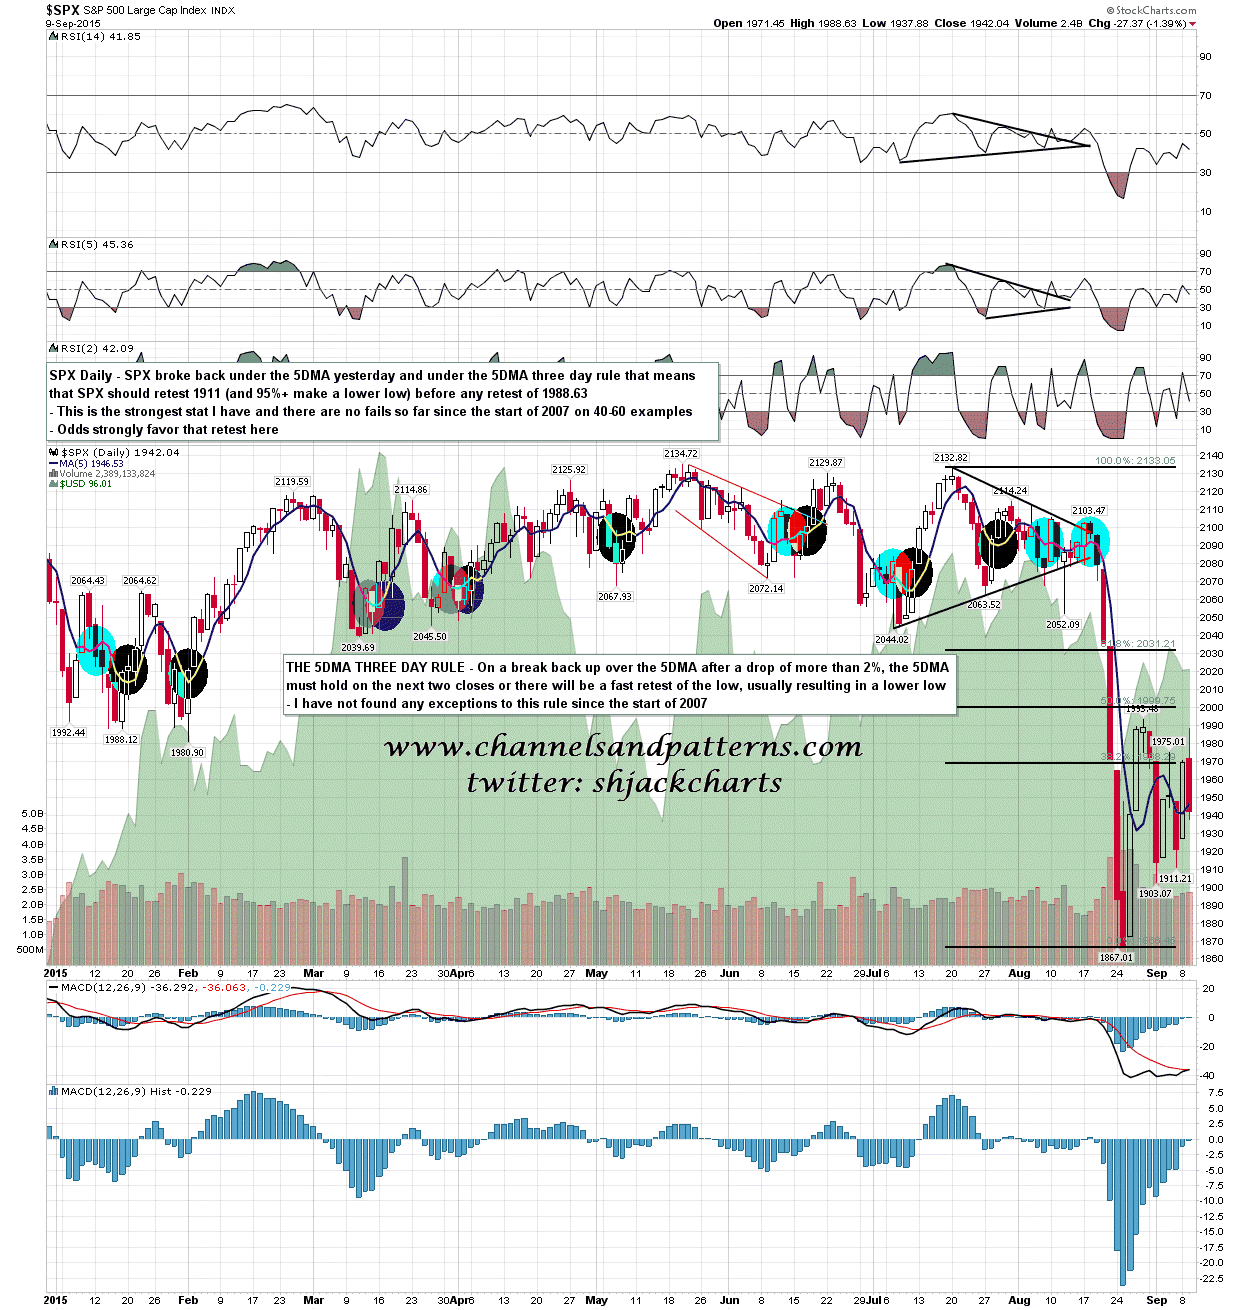
The decline yesterday was a hard fail at the retest of the daily middle band on many indices, and the close yesterday, and the open today was significantly under the SPX 5 day MA. On my 5DMA three day rule stat we should now see a retest of the last low at 1911, and 95%+ a lower low there, before there is another test of yesterday’s high at 1988.63. I have found no exceptions to this rule since the start of 2007 from at least 40 instances so I’m expecting a retest of 1911 soon, very possibly today. SPX daily 5DMA chart:
Slope of Hope Blog Posts
Slope initially began as a blog, so this is where most of the website’s content resides. Here we have tens of thousands of posts dating back over a decade. These are listed in reverse chronological order. Click on any category icon below to see posts tagged with that particular subject, or click on a word in the category cloud on the right side of the screen for more specific choices.
Give Blood
We’re heading for the day of reckoning, I’m telling ya. It’s all building up to something, something that can only be redeemed with fire!
Another Blow for BRIC
Well, the ridiculous “BRIC” meme (Brazil/Russia/India/China) suffered another embarrassment after hours, as Standard & Poors has downgraded the country’s bonds to junk level (and a negative outlook, although I’m not sure what is worse than “junk”). There are probably some people out there who gobbled up EWZ since it looked so “cheap”:

My Odd Relationship with EW
I have, over the nearly eleven years (!) this blog has been around, largely avoided the topic of Elliott Waves. There is no shortage of posts here on Slope, largely by others, about the Elliott Wave theory (click here to see the list of them) but for myself, I hardly ever mention it.
One thing to understand how I analyze the markets is that I’m pretty damned lazy about using
methods that don’t “sing” to me. That sounds like an odd verb to use, but it’s the one that’s always made the most sense. The things that sing to me – – those which resonate and make sense to me – – tend to be simple tools like horizontal support & resistance levels, trendlines, and, to a lesser degree, Fibonacci retracements.
I don’t go in for stochastics, Bollinger bands, relative strength indicators, moving averages, MACD, or any of that other stuff. I am awfully fond of analogs, as some of you know, but while some border on the magical (like the one I offered on Alcoa this year) others lead to completely erroneous predictions.
New Up-Leg in Yield?
As the global and U.S. equity markets stage a huge recovery rally, 10-year YIELD continues to creep higher– to 2.24% from the Aug 24 low at 1.90%– within a larger-developing bottoming pattern (outlined by the red lines below).
Current strength has propelled YIELD up and out of its near-term digestion (flag) pattern that triggers upside potential to challenge its Jan, 2014, resistance line, now at 2.40%.
Only a break below 2.11% will wreck the developing bullish set-up in YIELD.
Originally published on MPTrader.com.


