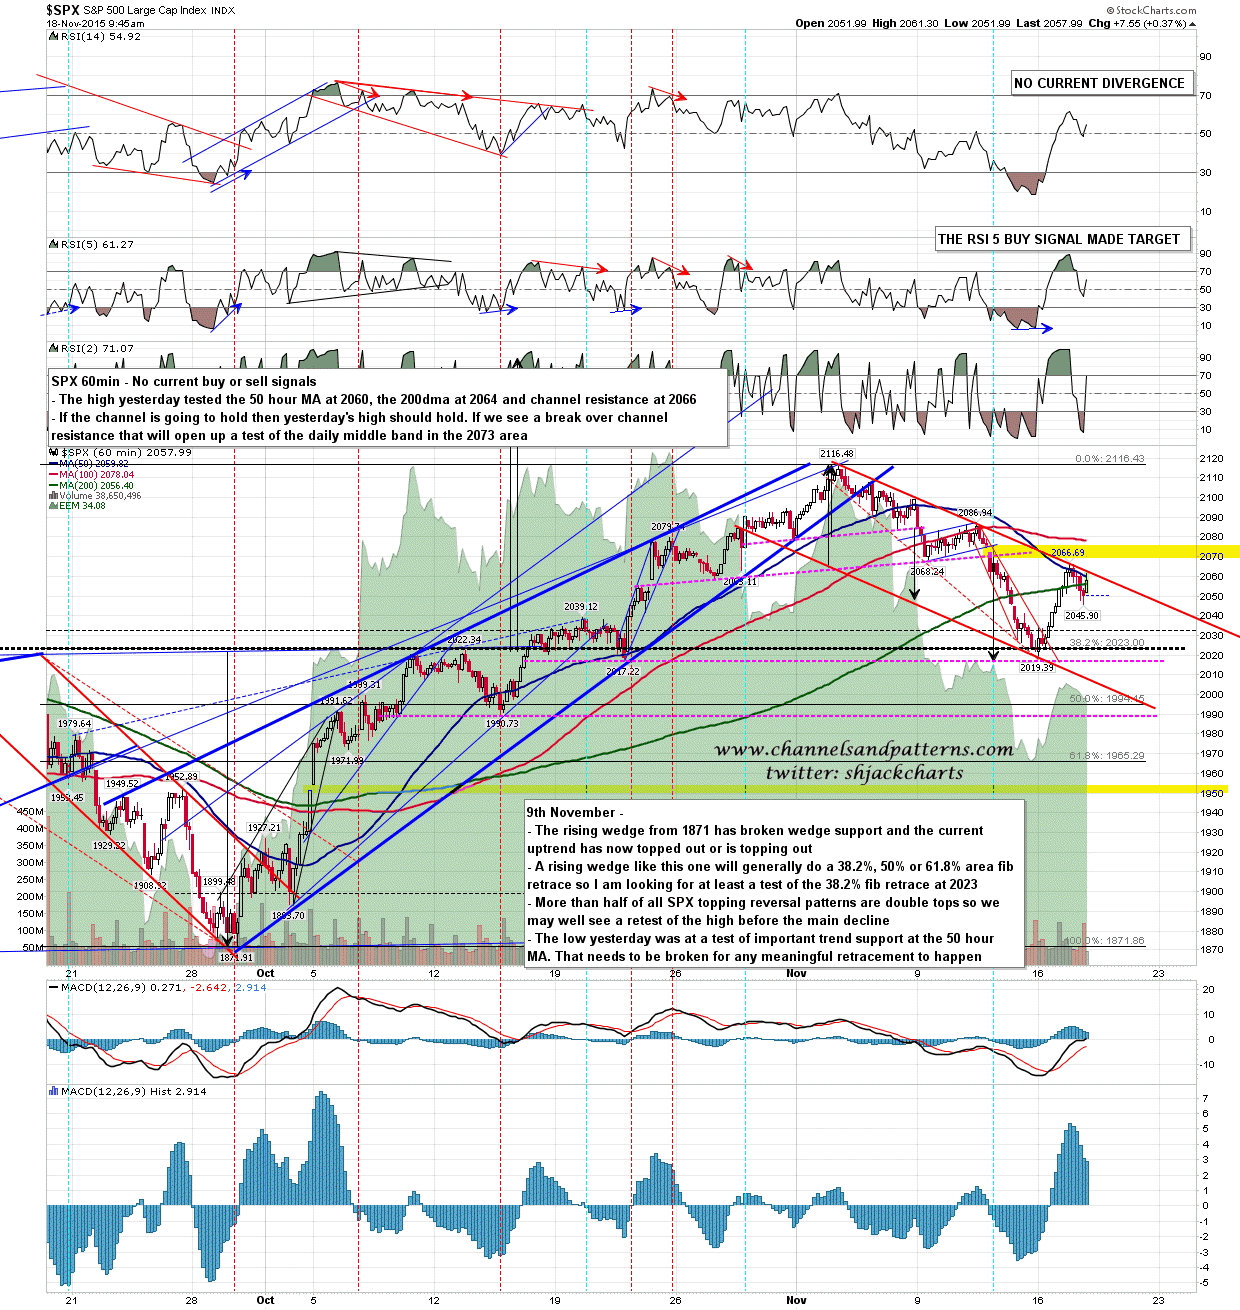
SPX tested falling channel resistance at the high yesterday and if that channel is going to hold then yesterday’s high shouldn’t be tested today. That high was a test of the 50 hour MA at 2060, the 200dma at 2064 and channel resistance at 2066. If the channel breaks then the path is clear for a test of the daily middle band in the 2073 area. SPX 60min chart:
Slope of Hope Blog Posts
Slope initially began as a blog, so this is where most of the website’s content resides. Here we have tens of thousands of posts dating back over a decade. These are listed in reverse chronological order. Click on any category icon below to see posts tagged with that particular subject, or click on a word in the category cloud on the right side of the screen for more specific choices.
NZD/USD Long
This would be a quick trade on NZDUSD, LONG, possibly targeting the 0.6546 target. NZDUSD has been up last week and up for the last 2 months (September and October, not November), we like it more SHORT than LONG, but a small opportunity for a quick profit is always worth trying.
This model below is our quantitative LONG model for NZDUSD LONG. What we do is to calculate statistically what price levels usually determine a trend reversal (i.e. a bounce), based on a very large databases that contains all the historical price retracements for this market since 1991, i.e. 25 years of data.