
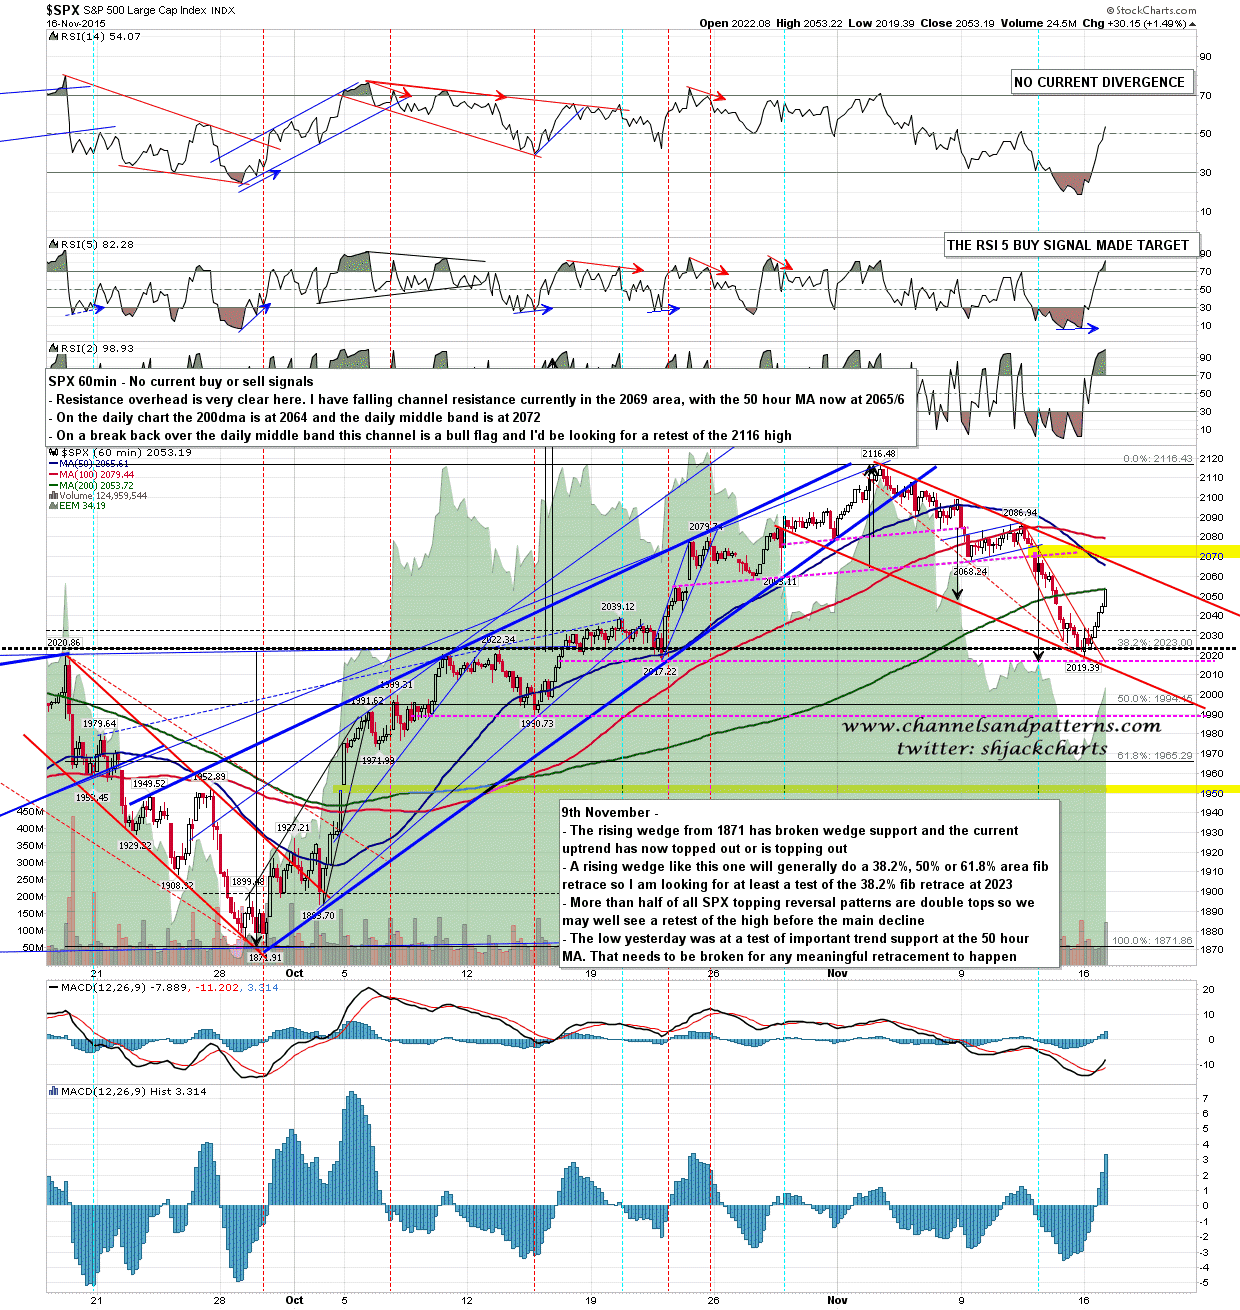
Well, rather faster than I was expecting, we are close to testing the resistance cluster that I was talking about yesterday morning. At the open this morning the cluster starts at the 200dma at 2064, then the 50 hour MA at 2065/6, falling channel resistance at 2069 and the daily middle band at 2072. As long as we see SPX turn here then I’ll be looking for 1990 next, and SPX may well be on the way back to 1871. On a break back above the daily middle band the falling channel is a bull flag and I’d be looking for a retest of the 2116 high. SPX 60min chart:
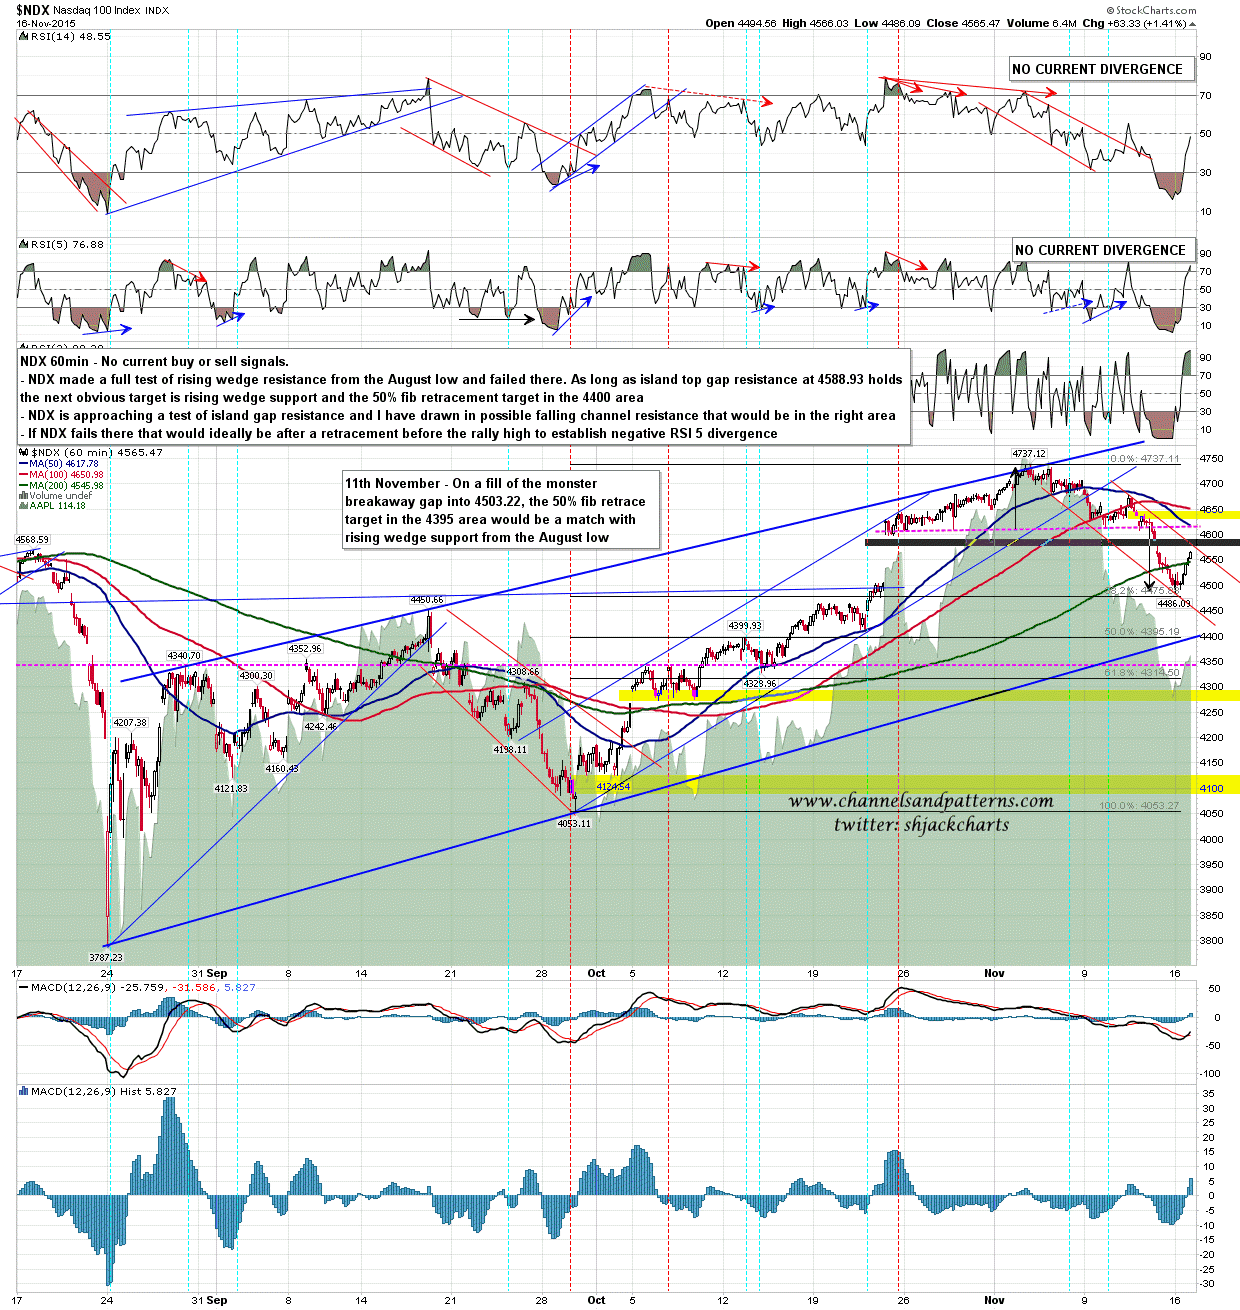
NDX is important here because there is currently an island top on NDX. There’s more than one gap above but if the gap from 4588.93 is filled I’ll be disregarding this setup. NDX 60min chart:
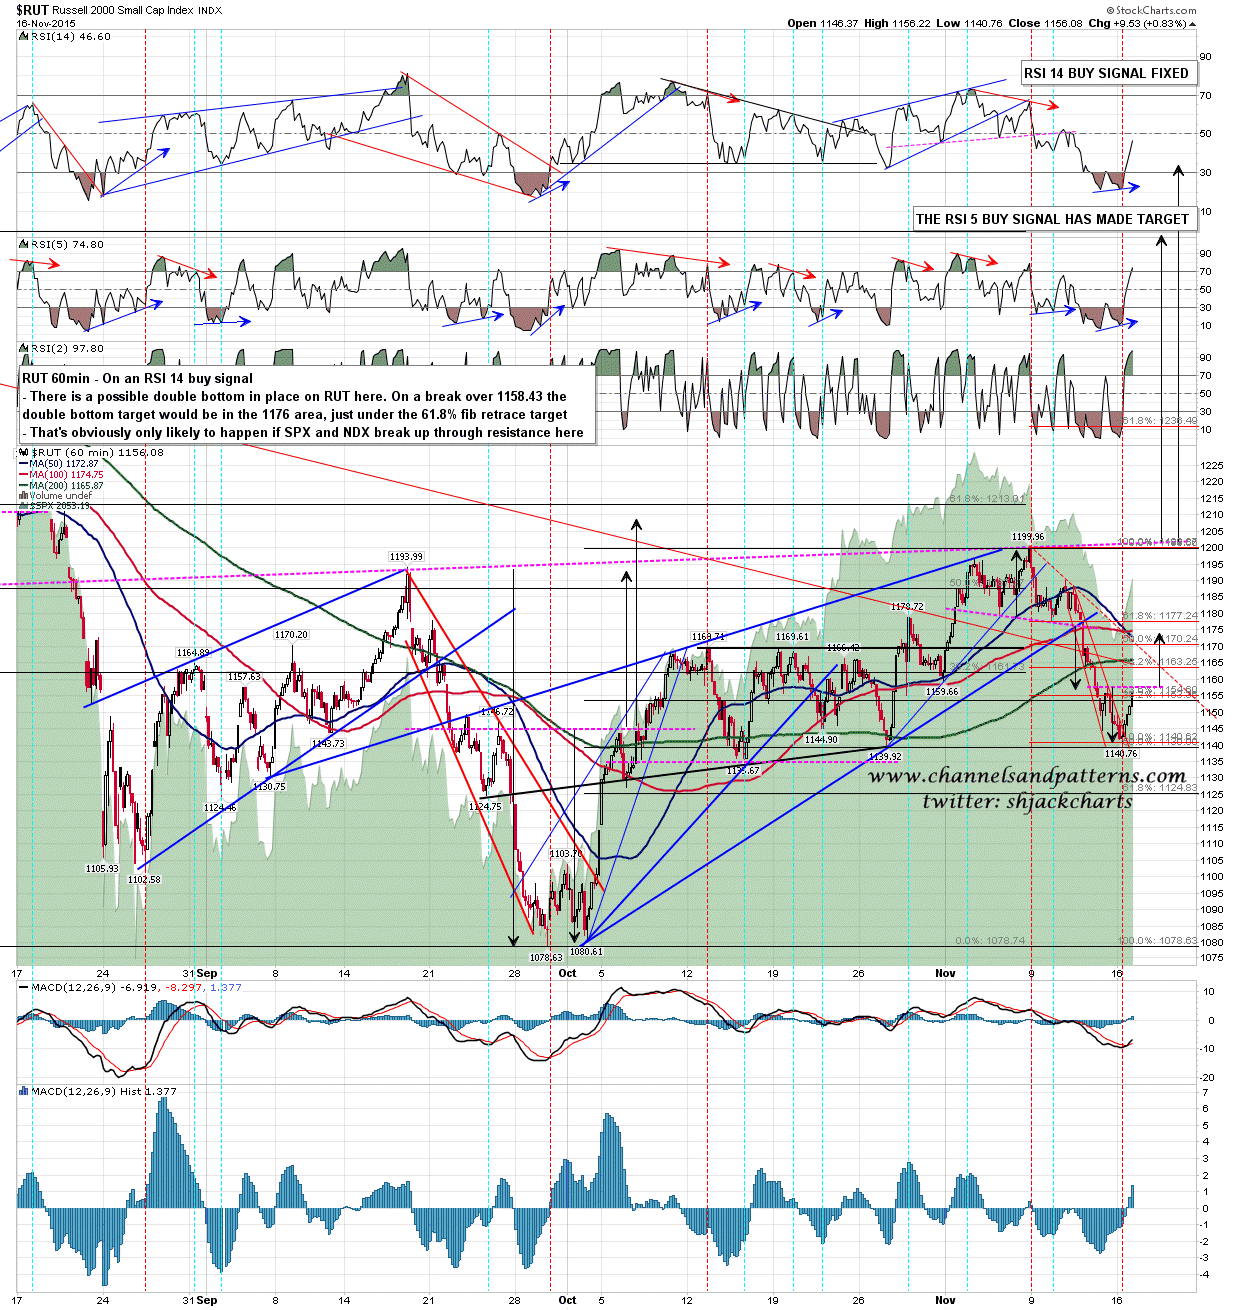
In the event that resistance breaks elsewhere then on a break over 1158.43 the double bottom target would be in the 1176 area. RUT 60min chart:
This is a definitional resistance test. If SPX resistance holds here then SPX is going lower. If SPX breaks back above the daily middle band then we’ll likely retest the 2116 high, at which point SPX goes higher and/or makes the second high of a double top.
