
If you have been following us in the past few weeks, you will know that we have been insisting saying that ES was a SHORT, in part because of the large number of consecutive higher WEEKLY closes (5 and then 6), which some people thought was an indication of strength with a high probability of continuation of the trend.
Obviously they don’t know what they are talking about.
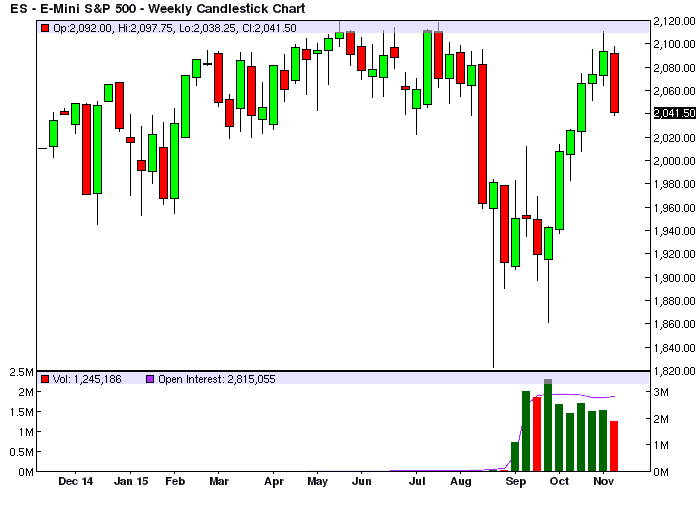
Here below is a WEEKLY chart that shows what (almost) always happens when a market pushes to its limits (this is the ES market, after 6 weeks up in a row):
Now, before some smarty-pants is going to jump up and say the money was made on the LONG side of this leg, please remember we have offered the BUY signal long time ago, when the market was down below 1900, so if you were a subscriber you know where the time to BUY was and if you did buy, it would have been a great success. After a certain point it was time to SELL and there we were until a few days ago…
Also note the correction is decently sized so far, not a complete retracement yet but hey, let’s see how much money you could do on this retracement by going SHORT using our model. The table below shows our current ES SHORT WEEKLY model, with 2 possible trading systems, one with stops, the other with averaging down (and a final stop, always use one).

You can see the potential profit if the market reached 2047.50 (currently reached ~2040 overnight, so we are being nimble and modest in our estimate) was 9725$ for the stop loss method and 6087.50$ for the averaging down method. This latter method is easier to use for an average trader and would have required about 34,537$ in capital in the trading account, so it’s about a 16% profit in a month, assuming you went SHORT in the week that ended on October 19th when the 2037.25 SHORT price on ES was reached. After that you just added another 3 contracts @ 2110 and wait for a pullback. Sure, it’s boring to wait one month and hold SHORT, but money is always made in time, it is a function of time, you can’t make a fortune in 5 minutes (unless you think you can do it with options, in which case we wish you really best of luck).
If you do not want to trade WEEKLY, we have DAILY models (think waiting 3-5 days instead of 3-5 weeks) and we also have HOURLY models for ES and NQ (think waiting a few hours to make a profit and be flat by the end of the day).
In case you wonder how do we calculated our profit target, is provided by our LONG model, i.e. it is a LONG level for a trade in the opposite direction, a level with good odds to go LONG. If you are a subscriber to our service you will know what levels the LONG model is showing for the current ES correction and you will be able to exit before ES goes back up in your face destroying all your SHORT profits.
Click here if you want to receive this E-mini S&P500 Analysis every day in your inbox.
