
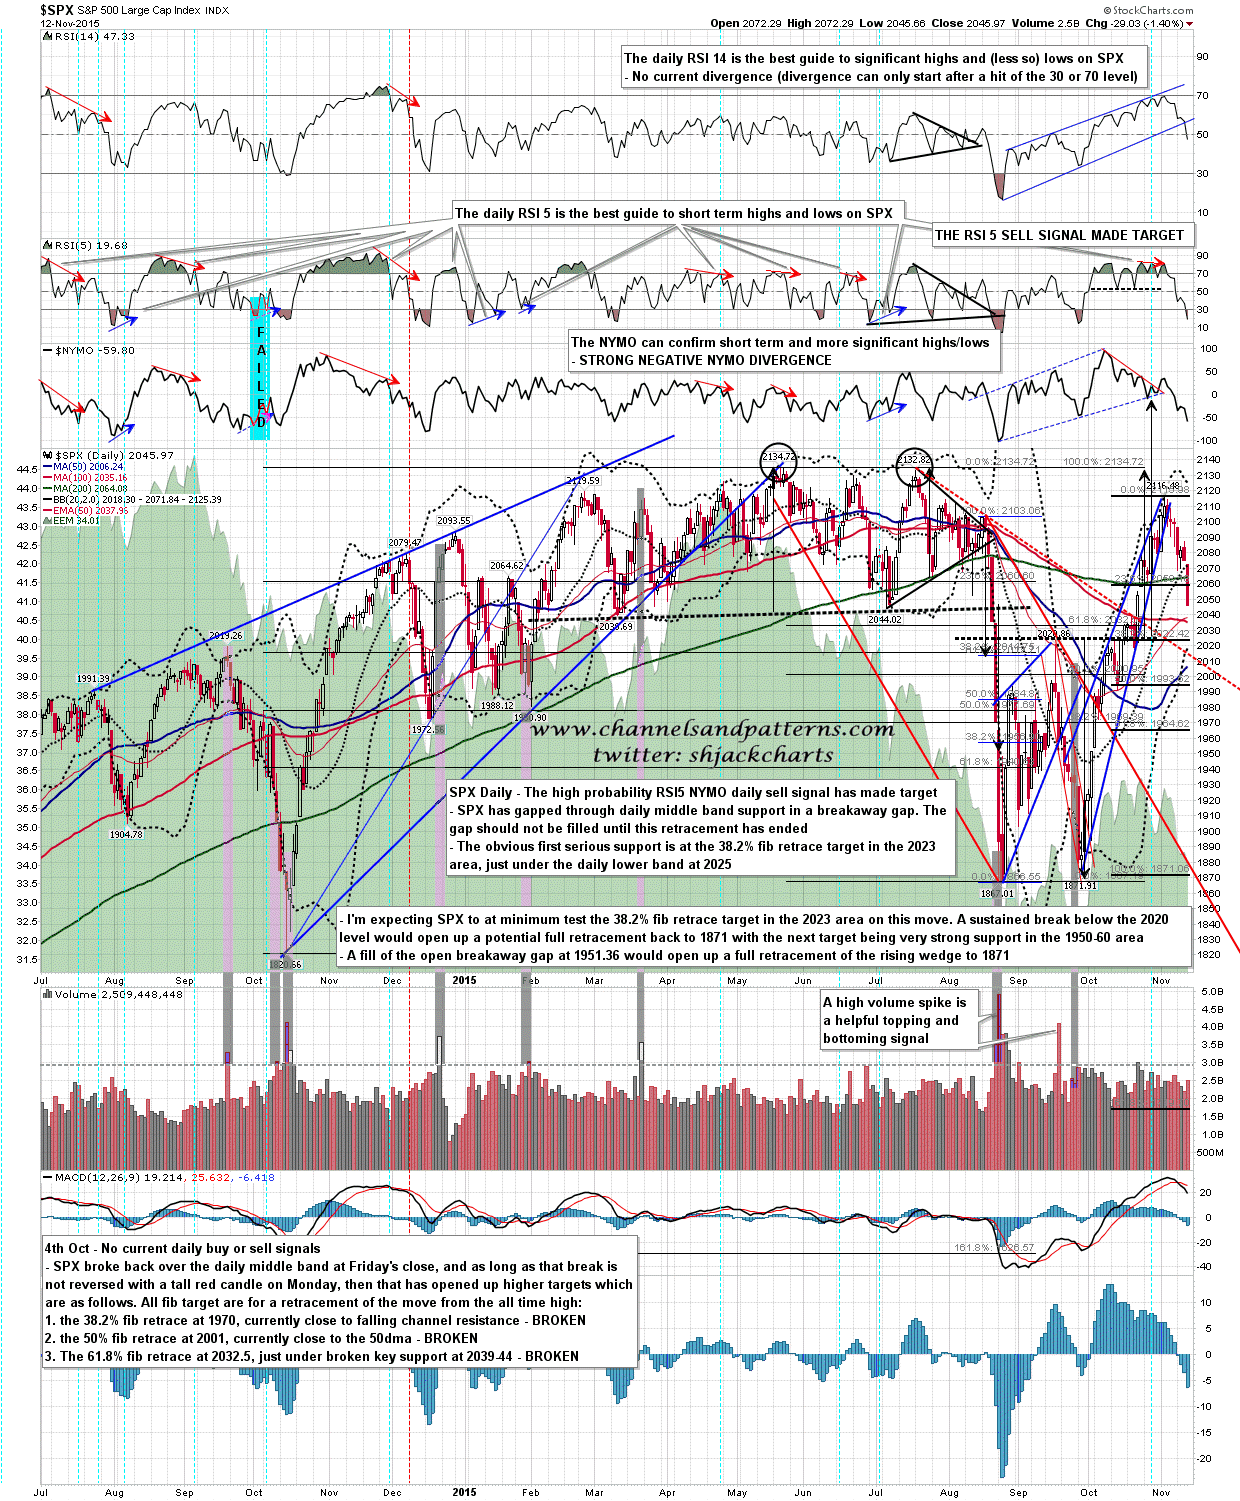
Well we got the breakaway gap down that I was looking for yesterday morning and all of those H&S patterns I posted yesterday have broken down. None of them have made target yet and I’m still looking at the 38.2% fib retrace at 2023 as first serious support and the obvious first target on SPX. The daily lower band is at 2025, broken resistance at 2022, and I have the H&S target in the 2018 area. This area could well be the low area for this retracement. SPX daily chart:
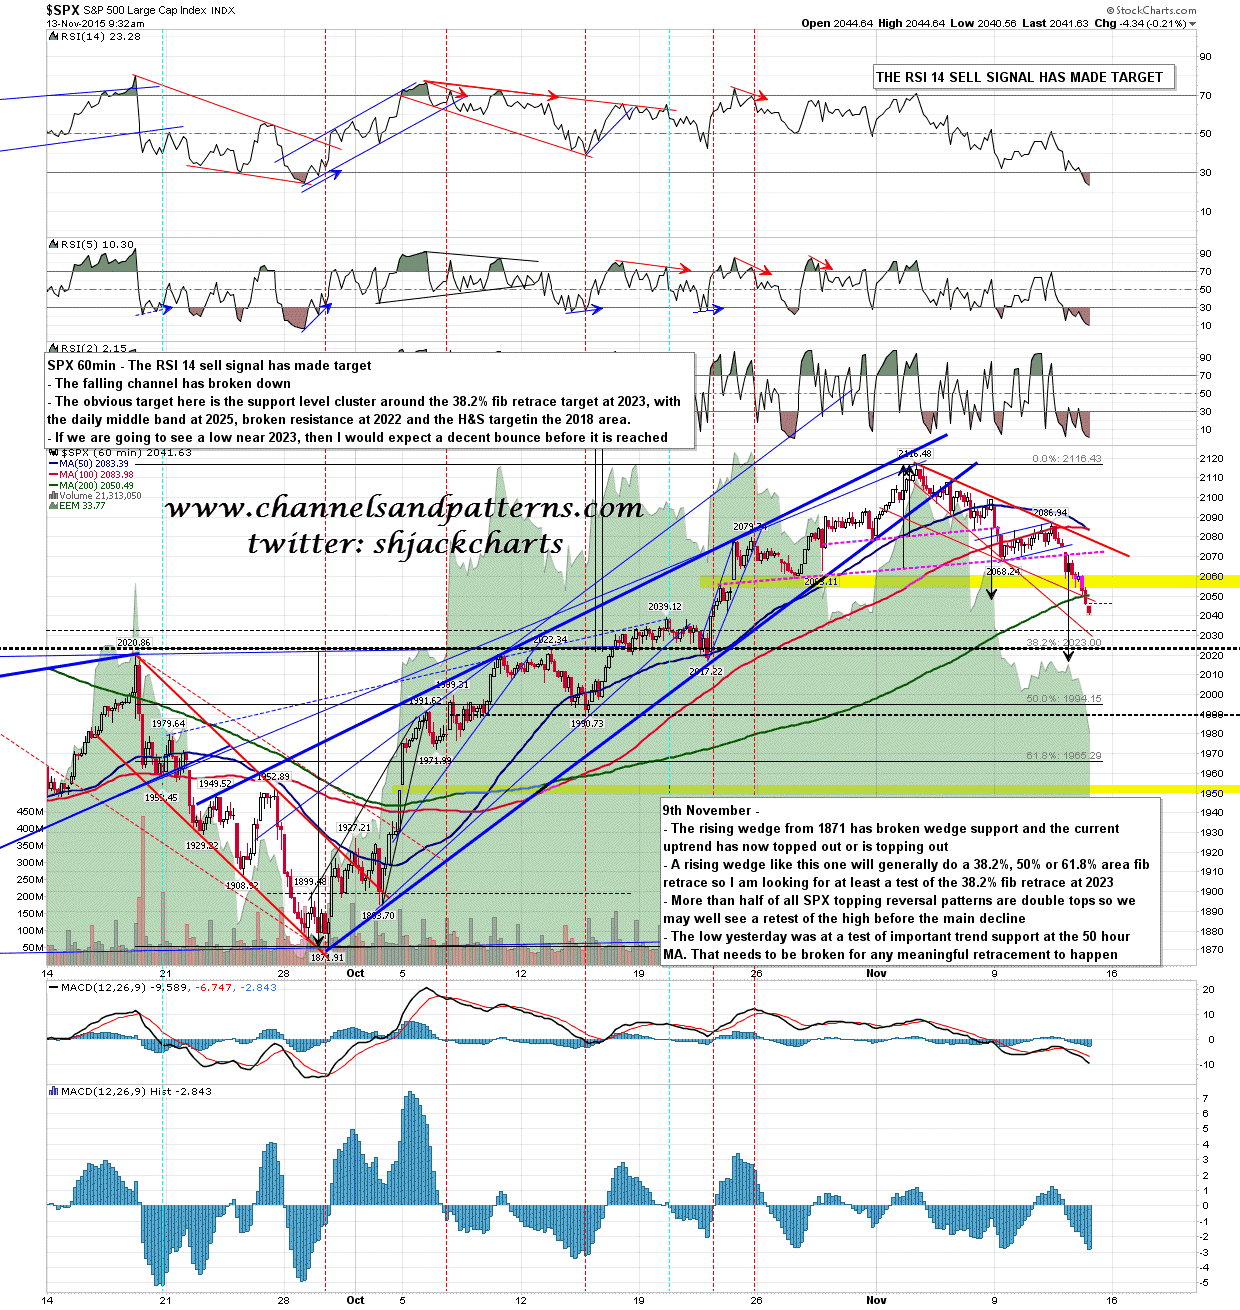
Both the daily RSI5_NYMO sell signal and the 60min RSI 14 sell signal have now made target, and if we are going to make a retracement low close to 2023 support I would expect a decent bounce first to set up positive divergence on the 60min RSI 14. SPX 60min chart:
I’m leaning towards seeing a bounce this morning but we may not see it. The first big support on SPX is around the 38.2% fib retrace target at 2023. I don’t have a decline pattern from the H&S break yet as that would require a bounce of some kind. If 2023 is going to be the retracement low I’d be looking for that bounce today.
