
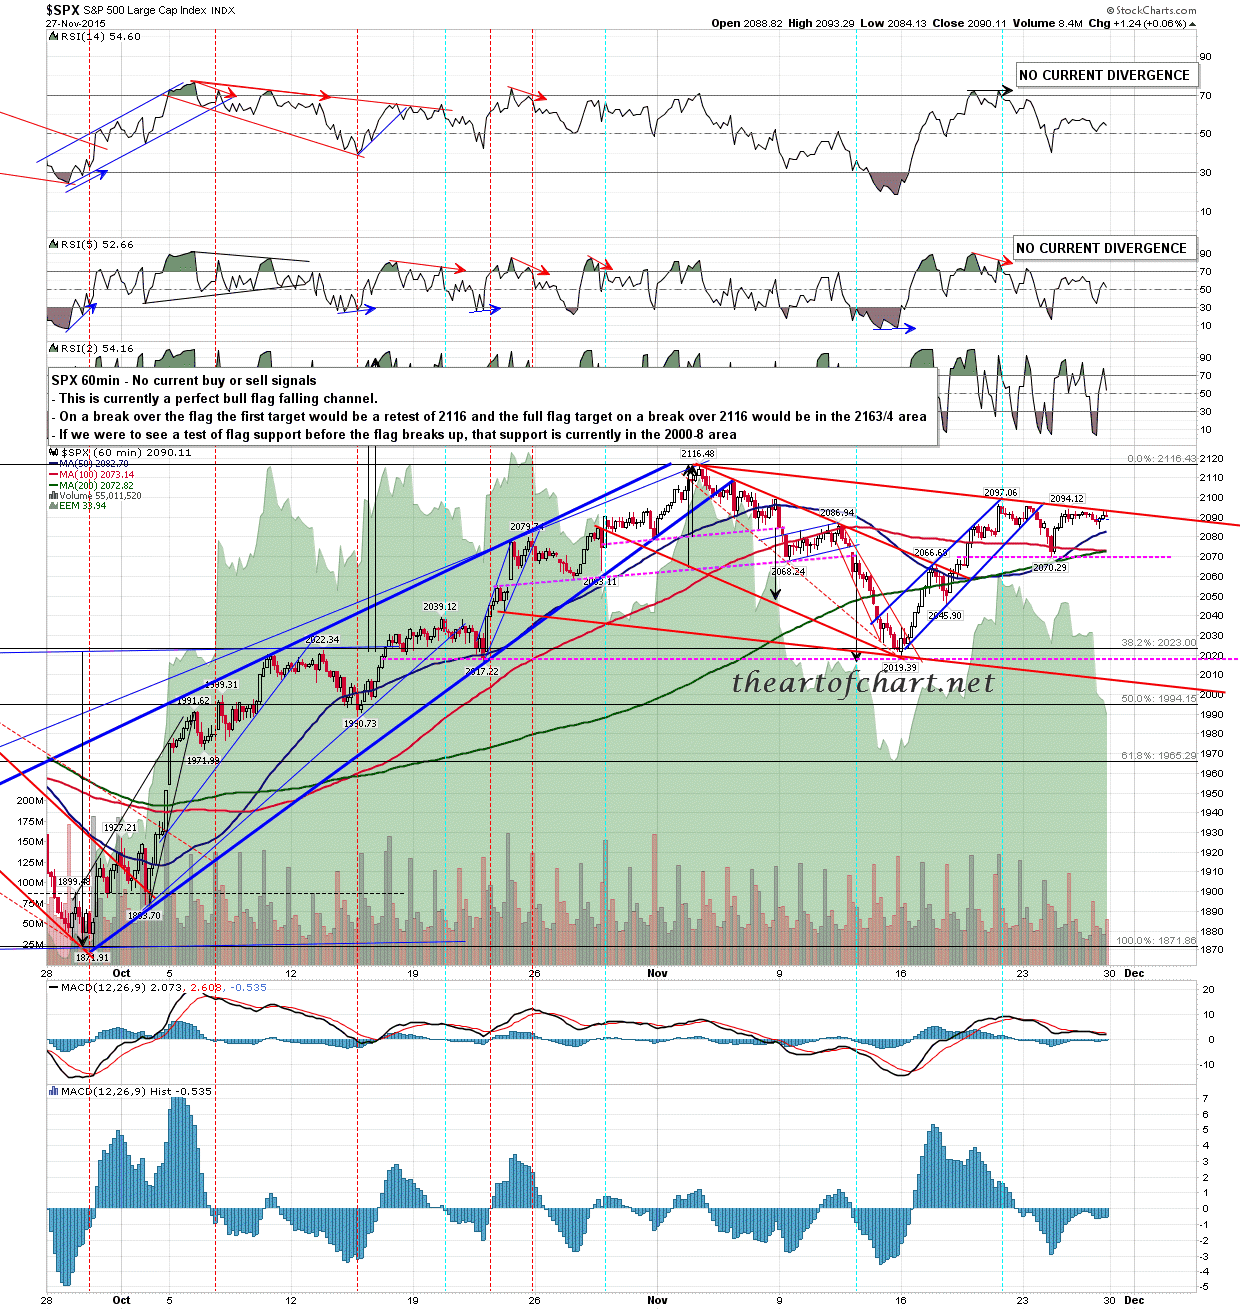
I think it’s pretty obvious that we’ll be seeing a test of the all time highs before going much lower, but the perfect bull flag channel on SPX here is saying that we may well see a decent dip to buy first. Key support is at 2070 and if that breaks without first seeing a break of flag channel resistance, it’s still possible that we could see a test of flag support in the 2000-10 area. SPX 60min:
RUT is testing double trendline resistance here and is very short term overbought on RSI. There are both RSI 5 and RSI 14 sell signals on the 15min chart. The obvious next move is a test of short term channel support in the 1187-90 area. RUT 60min chart:

NDX is already on a 60min RSI 14 sell signal of course. NDX 60min chart:

SPX flag resistance is in the 2093 area, and a break above kills off the possible setup for a retest of 2000. Key uptrend support is at the 50 hour MA at 2082.70. A sustained break below opens a test of 2070, and a break below 2070 opens up a retest of the 2040 area.
Today is a cycle trend day, so there are 70% odds that either buyers or sellers will dominate the tape today. The volume is low though so that may affect the odds.
Stan and I are doing a free Chart Chat every fourth Sunday, and the next one is on Sunday 6th December. It should be a very interesting one with the current setups here on USD, gold, oil, natgas, sugar etc so I’d sign up early to make sure that you have a place. You can sign up for that here.
