
I never managed to get a post out yesterday in the end as I was preparing for my vacation so I’m doing an early post today before I go using charts I did last night for Basic Chart Service subscribers at theartofchart.net.
SPX inched a little higher yesterday and a possible strong RSI5_NYMO daily sell signal is now brewing. SPX may go a little higher but not much I suspect, and I am expecting that sell signal to fix within a couple of days. After it does I’m expecting a retracement to at minimum test the daily middle band, which closed yesterday at 2111, and likely lower. SPX daily chart:

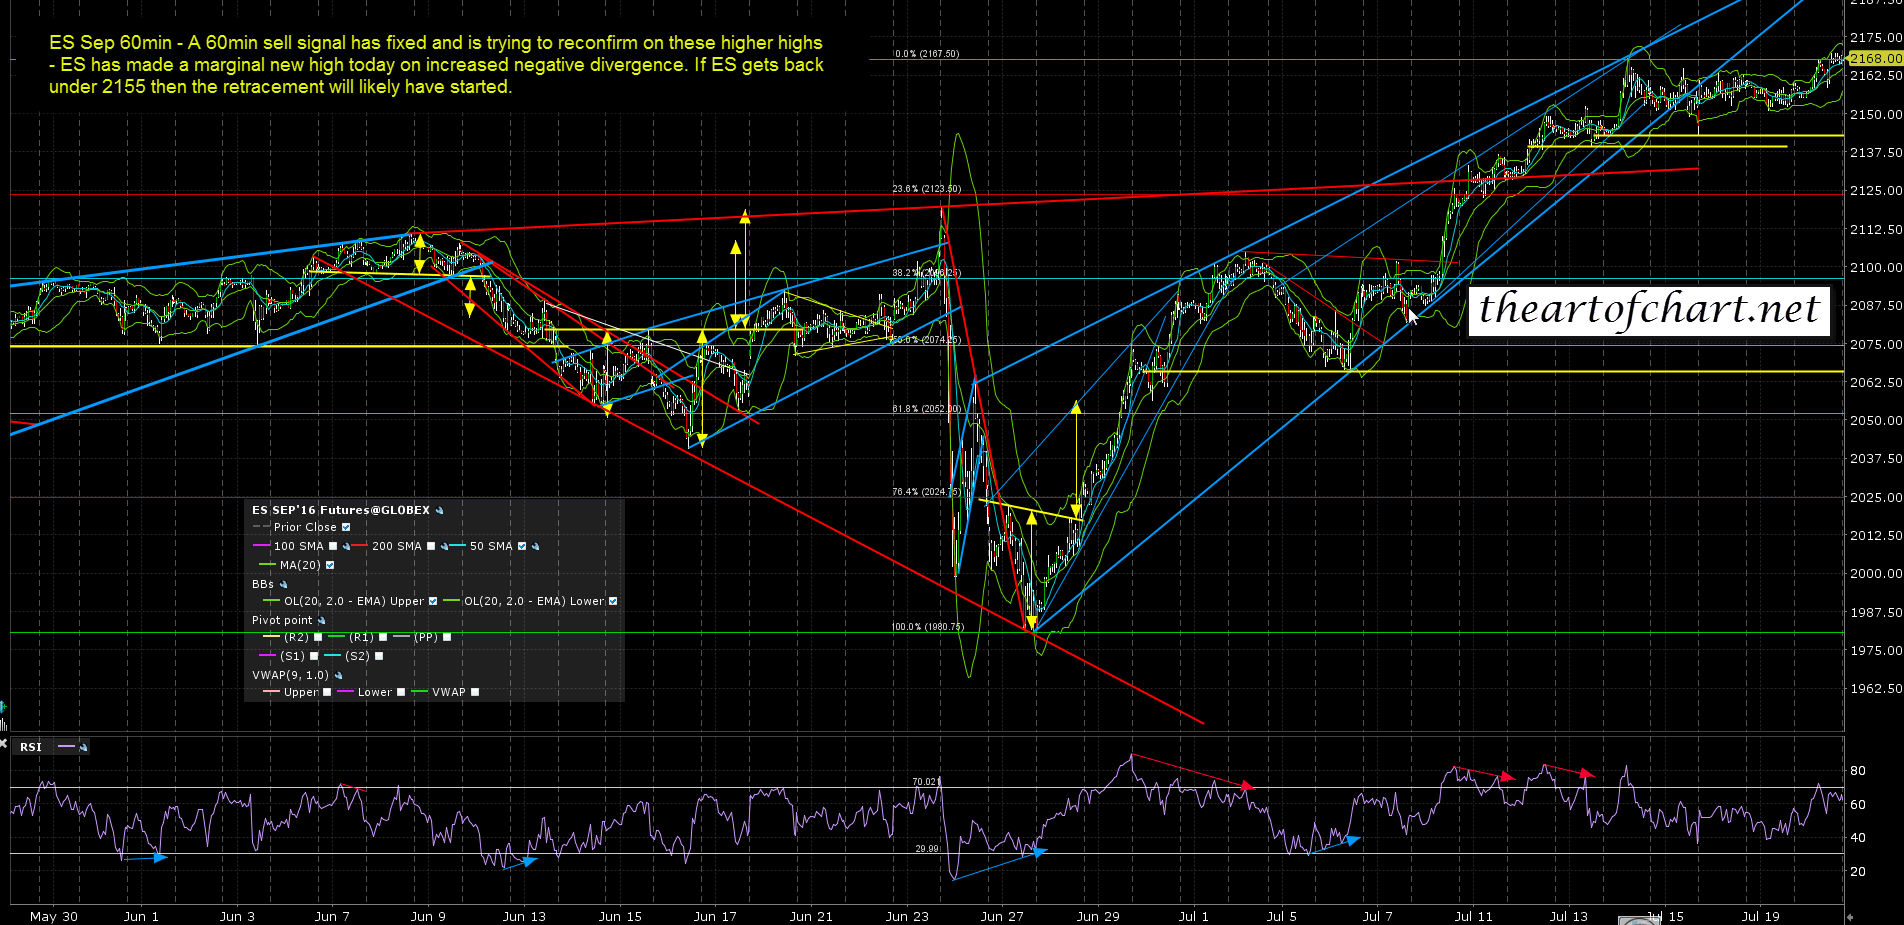
ES could fail any time on this setup and if it fails today then there is already a decent looking possible double top formed to get the ball rolling. ES Sep 60min chart:
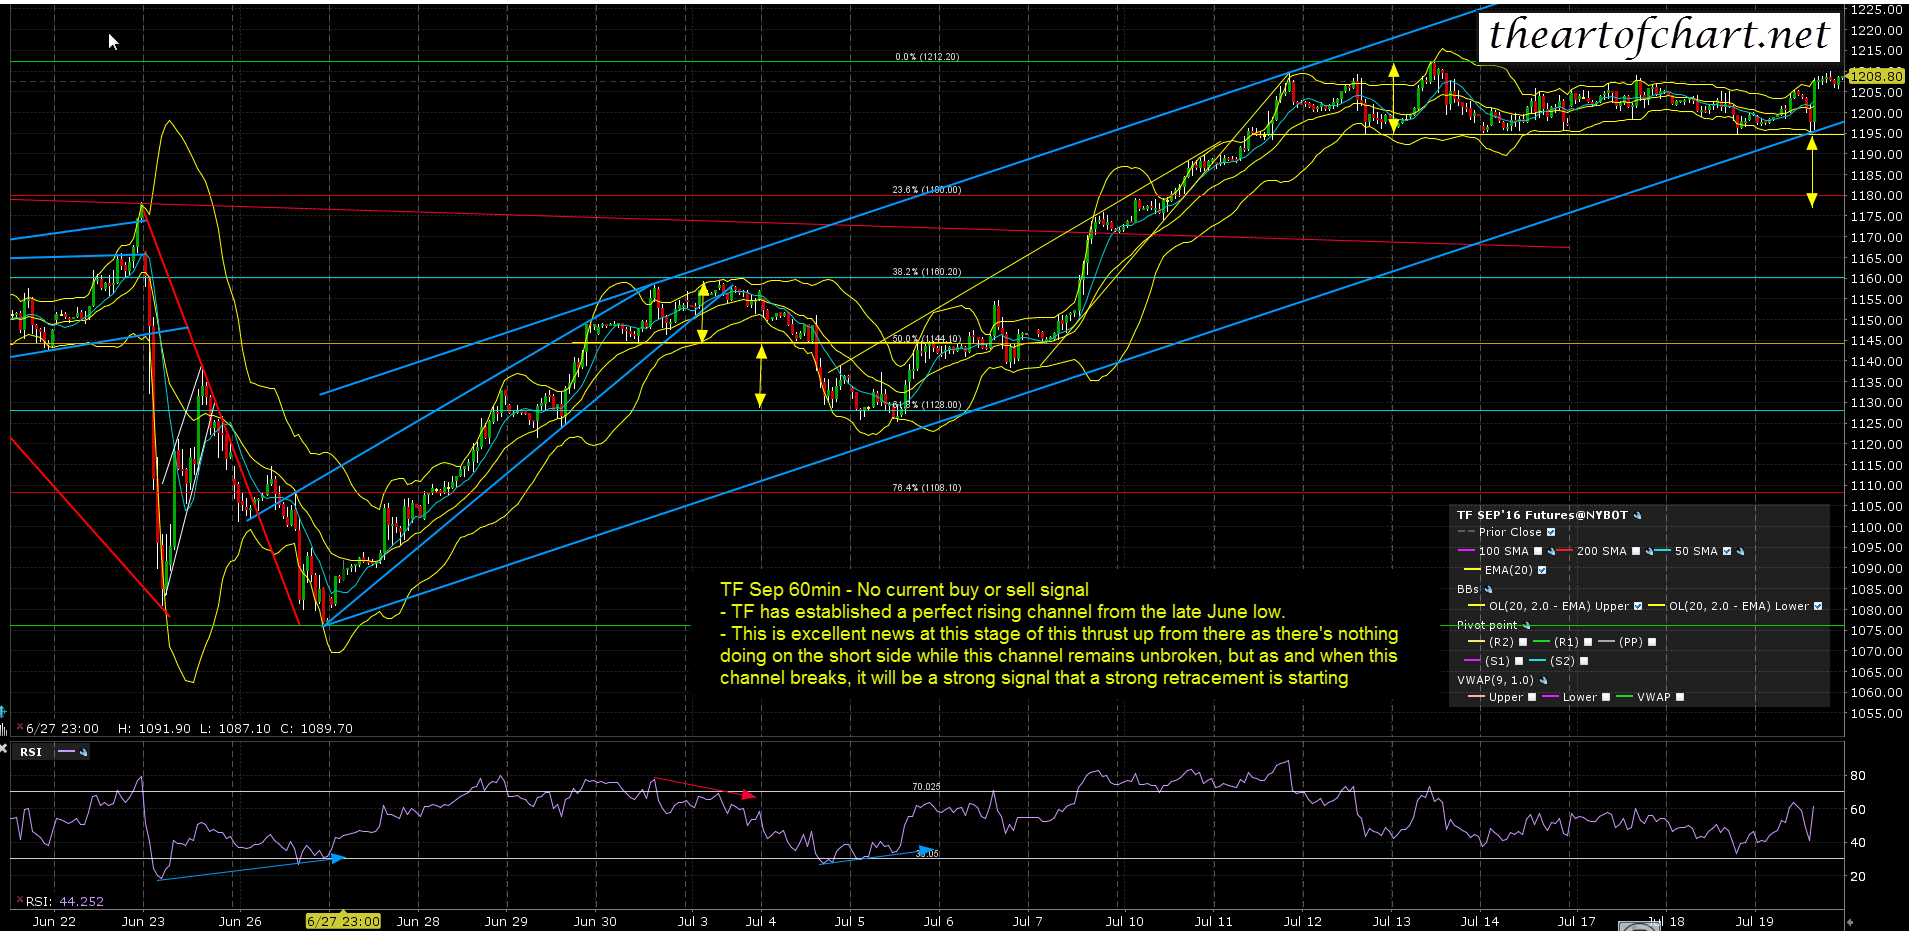
One thing I was very pleased to see last night was that after TF broke rising support from the 1085 low, a rising channel from that low was then established. This gives us a very useful marker for when this uptrend has likely topped out. There’s not a lot happening on the short side while this channel survives. After it fails there shouldn’t be much of interest on the long side until SPX at least retests the daily middle band as support. TF rising channel support is currently in the 1201/2 area. TF Sep 60min chart:
After this coming retracement completes we should see more new all times highs on SPX, so I’ll be keeping an eye out looking for a low and will be posting updates every so often on my twitter feed, which you can see here. I’m on vacation until Sunday 31st July, so my next morning post will be on Monday 1st August.
