
SPX and NDX showed the first significant signs of weakness in a couple of weeks on Friday, with breaks below the support trendlines on decently formed rising wedges from the late June lows. Decent quality 60min RSI 14 sell signals have fixed on both SPX and NDX and that’s promising to deliver some retracement soon, though the swing high may not be in, and I’m still waiting for RUT to join the other two with a trendline support break and negative RSI divergence.
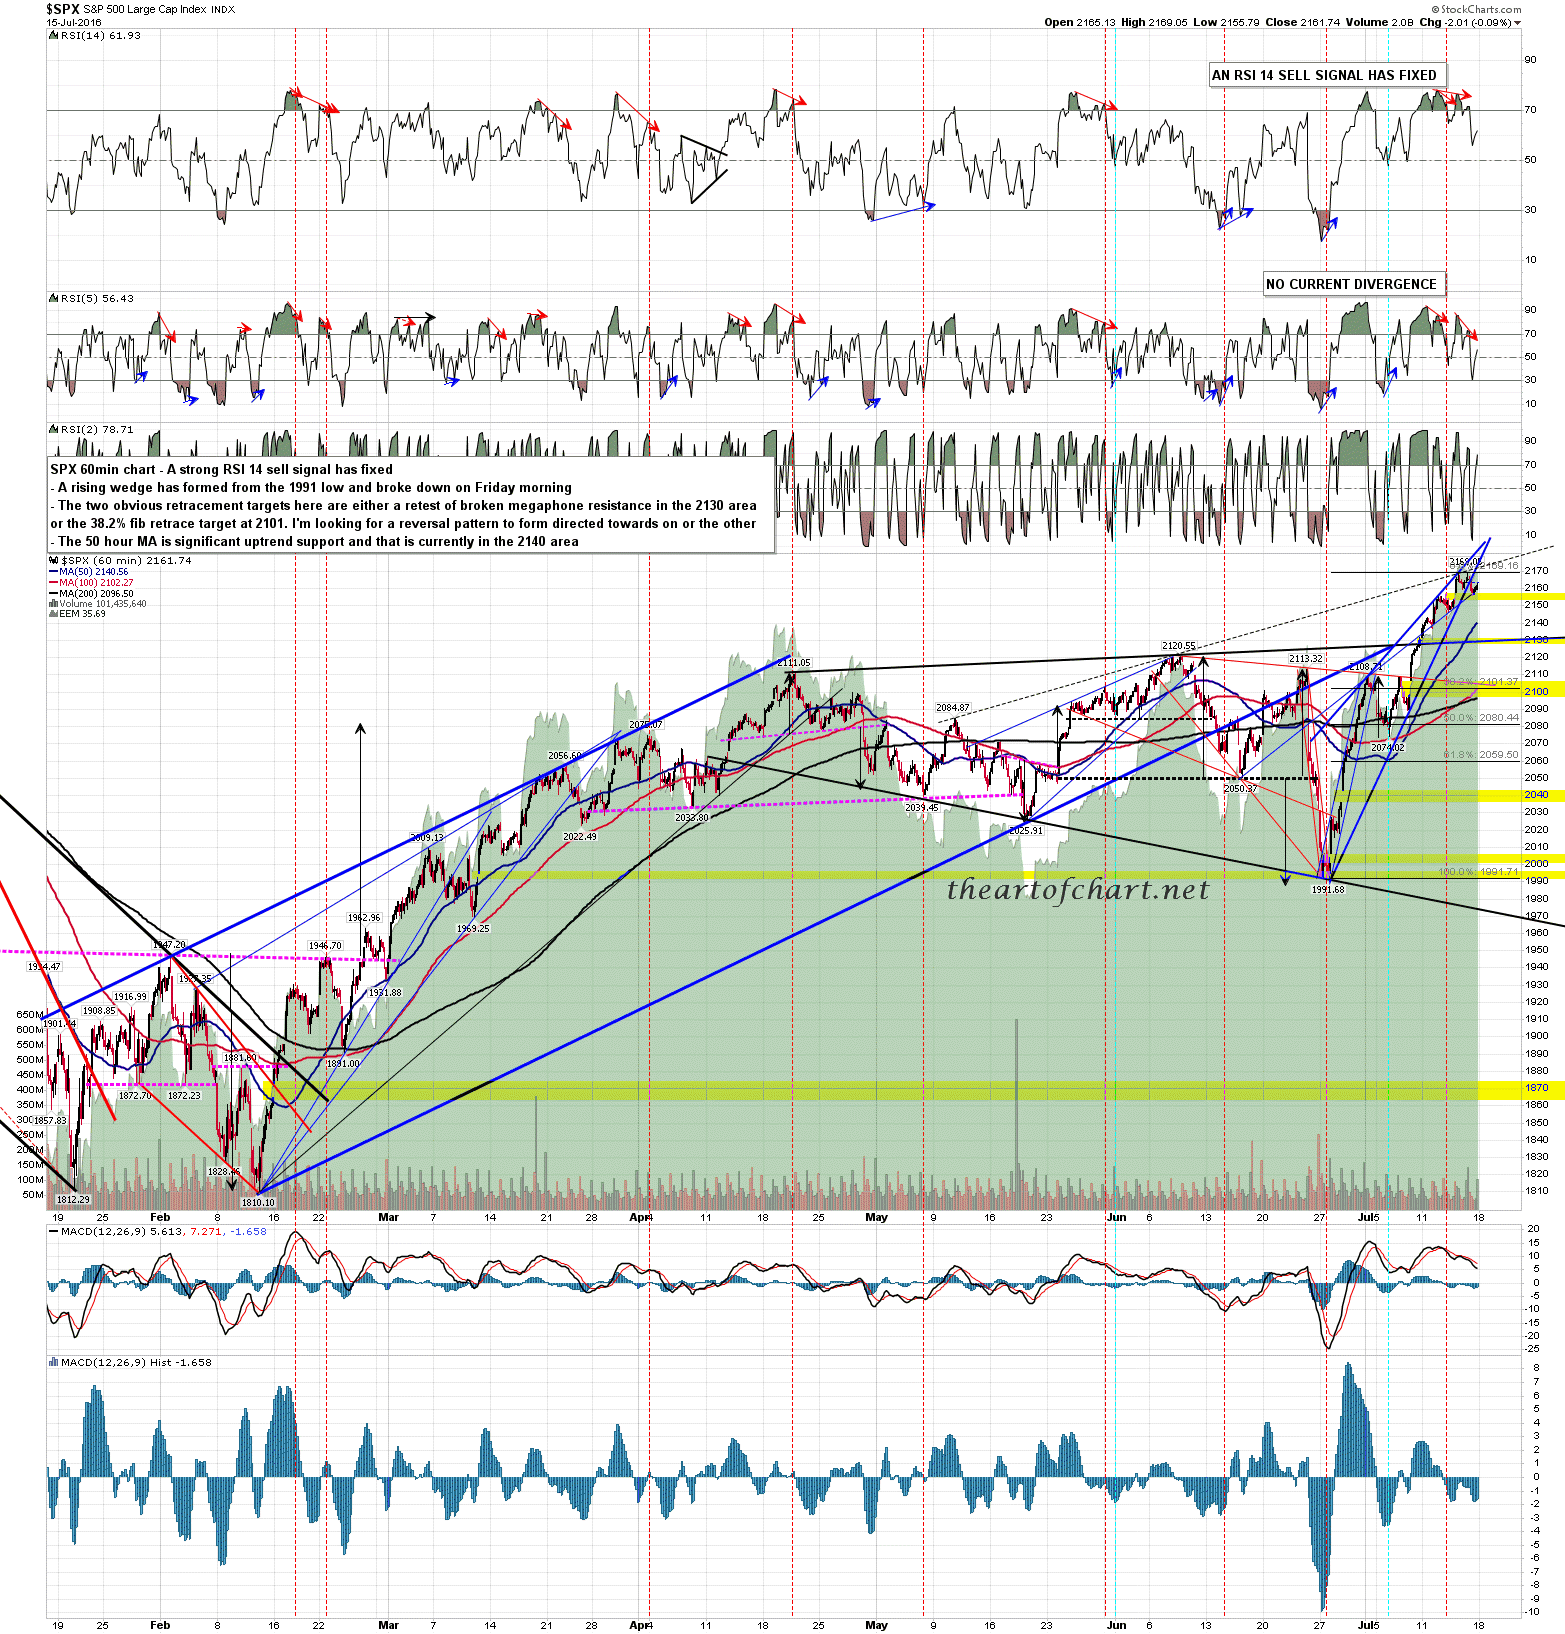
Nonetheless, I think all three indices are likely in a short term topping process here, and am looking for topping patterns to form for a decent retracement of 3% or more starting in the next few days. I’m expecting that to be a dip to buy. SPX 60min chart:
How far might this move ultimately go? Well, that could be significantly higher. I’m using the IHS on the FTSE chart as one milestone marker here, and I’m expecting FTSE to at least retest the all time high slightly over 5% higher, and FTSE may make the full IHS target almost 10% higher. Hard to say what that would be on SPX, but significantly higher at the least. FTSE daily chart:

Moves like this don’t tend to turn on a dime and while I think the swing high is close, SPX may well be in a topping process for the first half of this week. Stan has his eye on 2181 SPX as a possible swing high area.
I’m going to be on holiday from Thursday through to the end of next week. Last regular post will be on Wednesday though I’m expecting to put up at least a couple of charts while I’m away.
