Originally published on TheTechTrader.com.
Slope initially began as a blog, so this is where most of the website’s content resides. Here we have tens of thousands of posts dating back over a decade. These are listed in reverse chronological order. Click on any category icon below to see posts tagged with that particular subject, or click on a word in the category cloud on the right side of the screen for more specific choices.
Originally published on TheTechTrader.com.
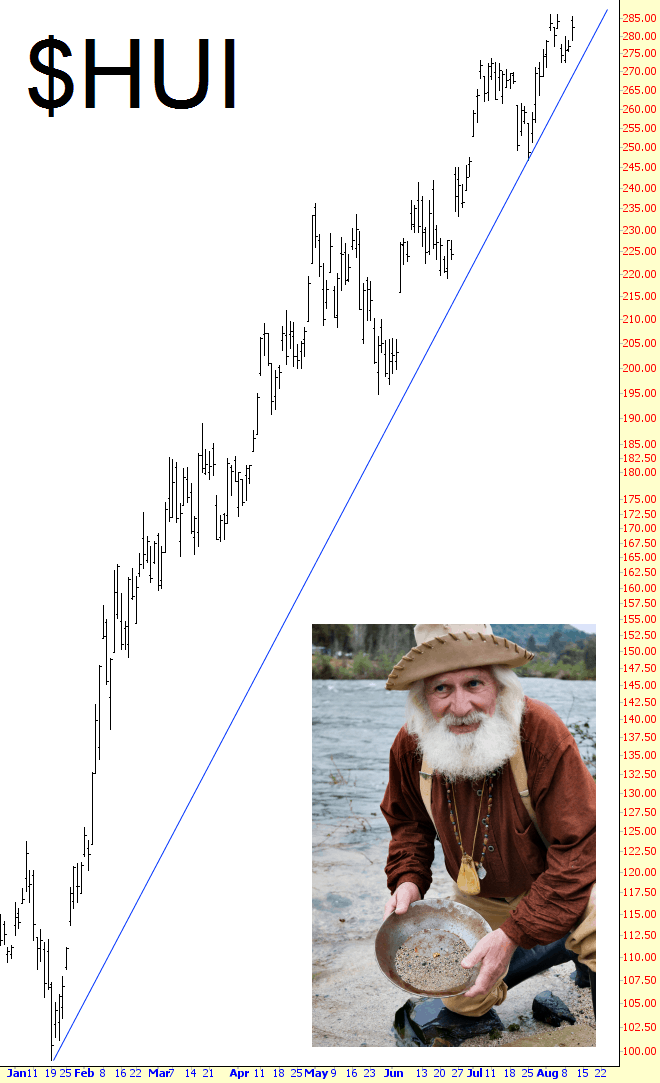
As pleased as I am to see precious metals (and their miners) thriving in 2016, I simply want to point out the trendline that’s being followed by the gold bugs index is supremely sharp, almost into the realm of hockey-stick-land. There’s nothing broken yet, but this line demands attention.
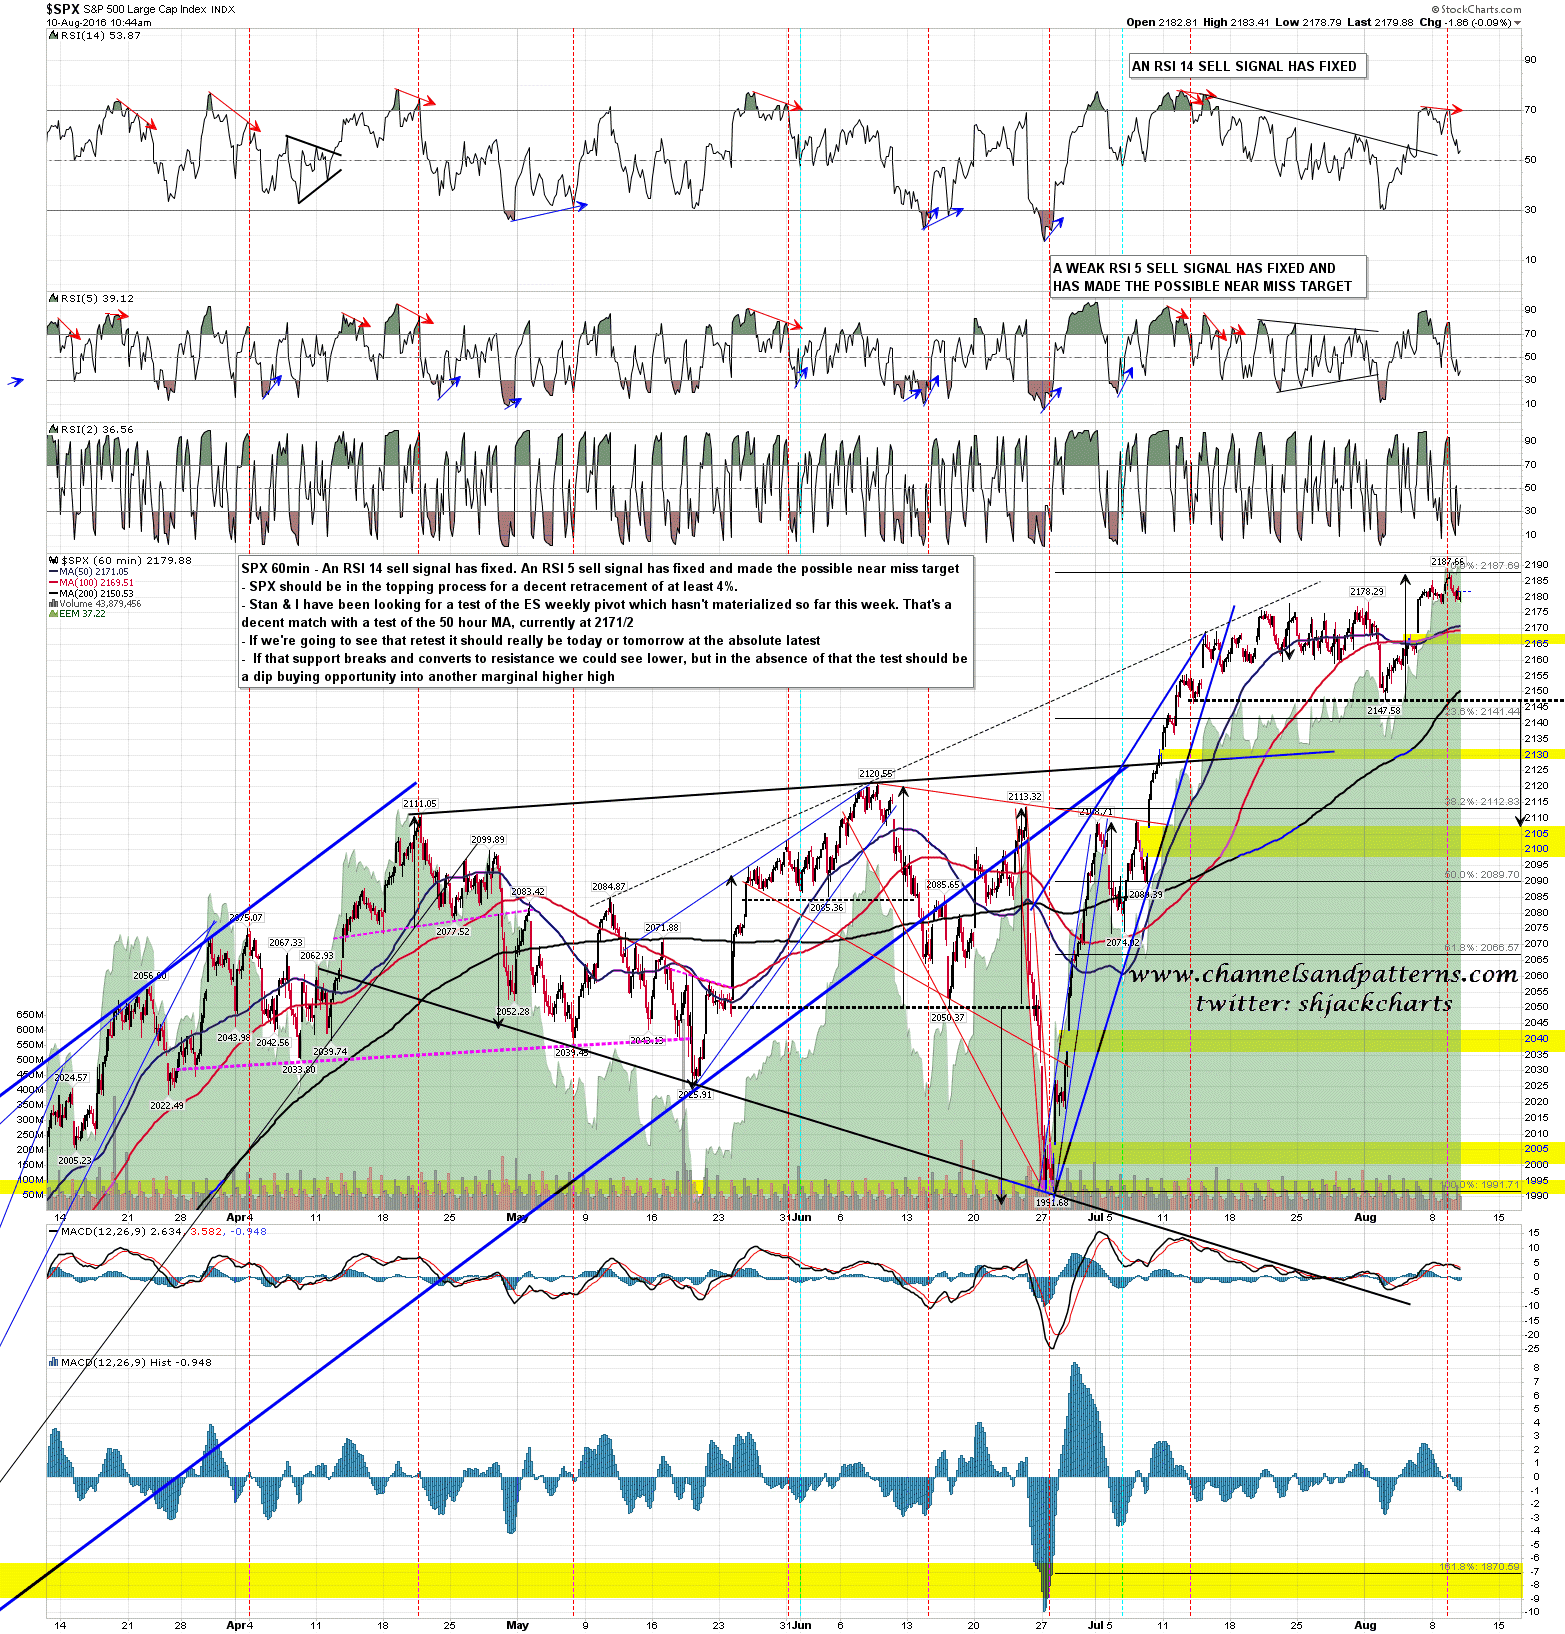
This is some very slow tape. We haven’t seen tape this slow since last August, at the last very hard compression of the daily bollinger bands. One of my trading buds asked then whether we would every see volatility return to SPX and it was back soon after. It should be back soon here too but it may be a few days longer.
Since the start of the week Stan and I have been waiting for a test of the ES weekly pivot at 2165/6 and that’s a decent match today with the SPX 50 hour MA, currently at 2171/2. A 60min sell signal has now fixed and we should now see that test as a minimum target. If that level breaks and converts to resistance then we could see a larger retracement. SPX 60min chart:
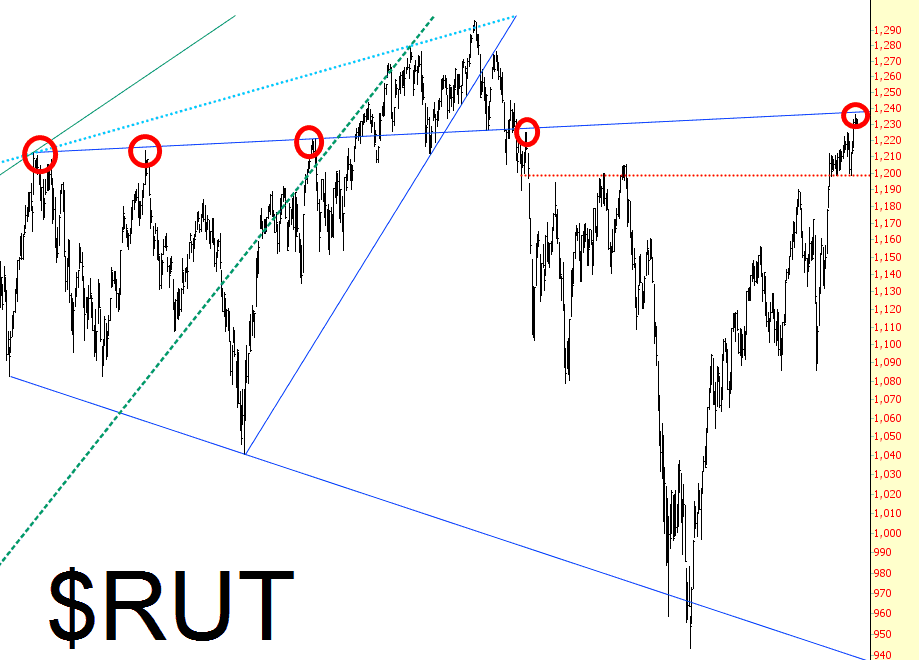
I’m back in my beloved Palo Alto, and I feel much more comfortable again, surrounded by screens and canines. Yesterday was decent to me, and today is as well; I am carefully watching the blue trendline I’ve drawn on the Russell 2000. God knows it would be nice to get a meaningful reversal that lasts more than 27 seconds or so.
First published Sat Aug 6 for members of ElliottWaveTrader.net: Last weekend, I prepared you for the potential set up for the 3rd wave to much higher levels in the metals complex. More specifically, I provided you with a map as to how the 3rd wave set up would look on the GDX, should the market comply by filling in our 8 minute chart as outlined:
As long as we do not break below that support, and ideally remain over the 1.00 extension at 29.87, then I will be looking to complete 5 waves up off the recent low, which I would classify as wave (i) of wave 3 of iii. That suggests that after a corrective wave (ii) pullback is seen, and we then break out over the top of wave (i), the market is well on its way into the heart of its 3rd wave, and targeting the 39-41 region next.
And, over the last week, the market has complied in almost textbook fashion. In fact, once we completed 5 waves up into the top of our wave (i) target region, I sent out an Alert with a target box for a wave (ii). On Friday, the market dropped right to the top of our target box.
While the micro count in the c-wave does not look quite complete, it would seem that the market could still see lower before this c-wave bottoms. But, as long as the GDX remains over 29, I am viewing this chart as being on the cusp of the heart of a 3rd wave break out, which is pointing to 39-41, and quite quickly.
Now, for those who will read my words and consider leveraging up to the hilt in an irresponsible manner, I want to interject reasons one should still maintain your standard risk management practices. Set ups such as these are estimated to be about 70% probability. That still means there is a 30% probability that it could fail. One of the reasons this set up could fail is because all retracements in the GDX chart have been VERY shallow. This forces an analyst such as myself to make certain educated assumptions about where 2nd waves in the structure are located (since they are otherwise deeper retracements), which can have an effect upon the overall wave count if even one of those assumptions is wrong.
