
Apologies for the very late post. I’m reorganising my schedule to make it easier to get these posts out before the market opens, which I’m hoping will make keeping up with everything easier.
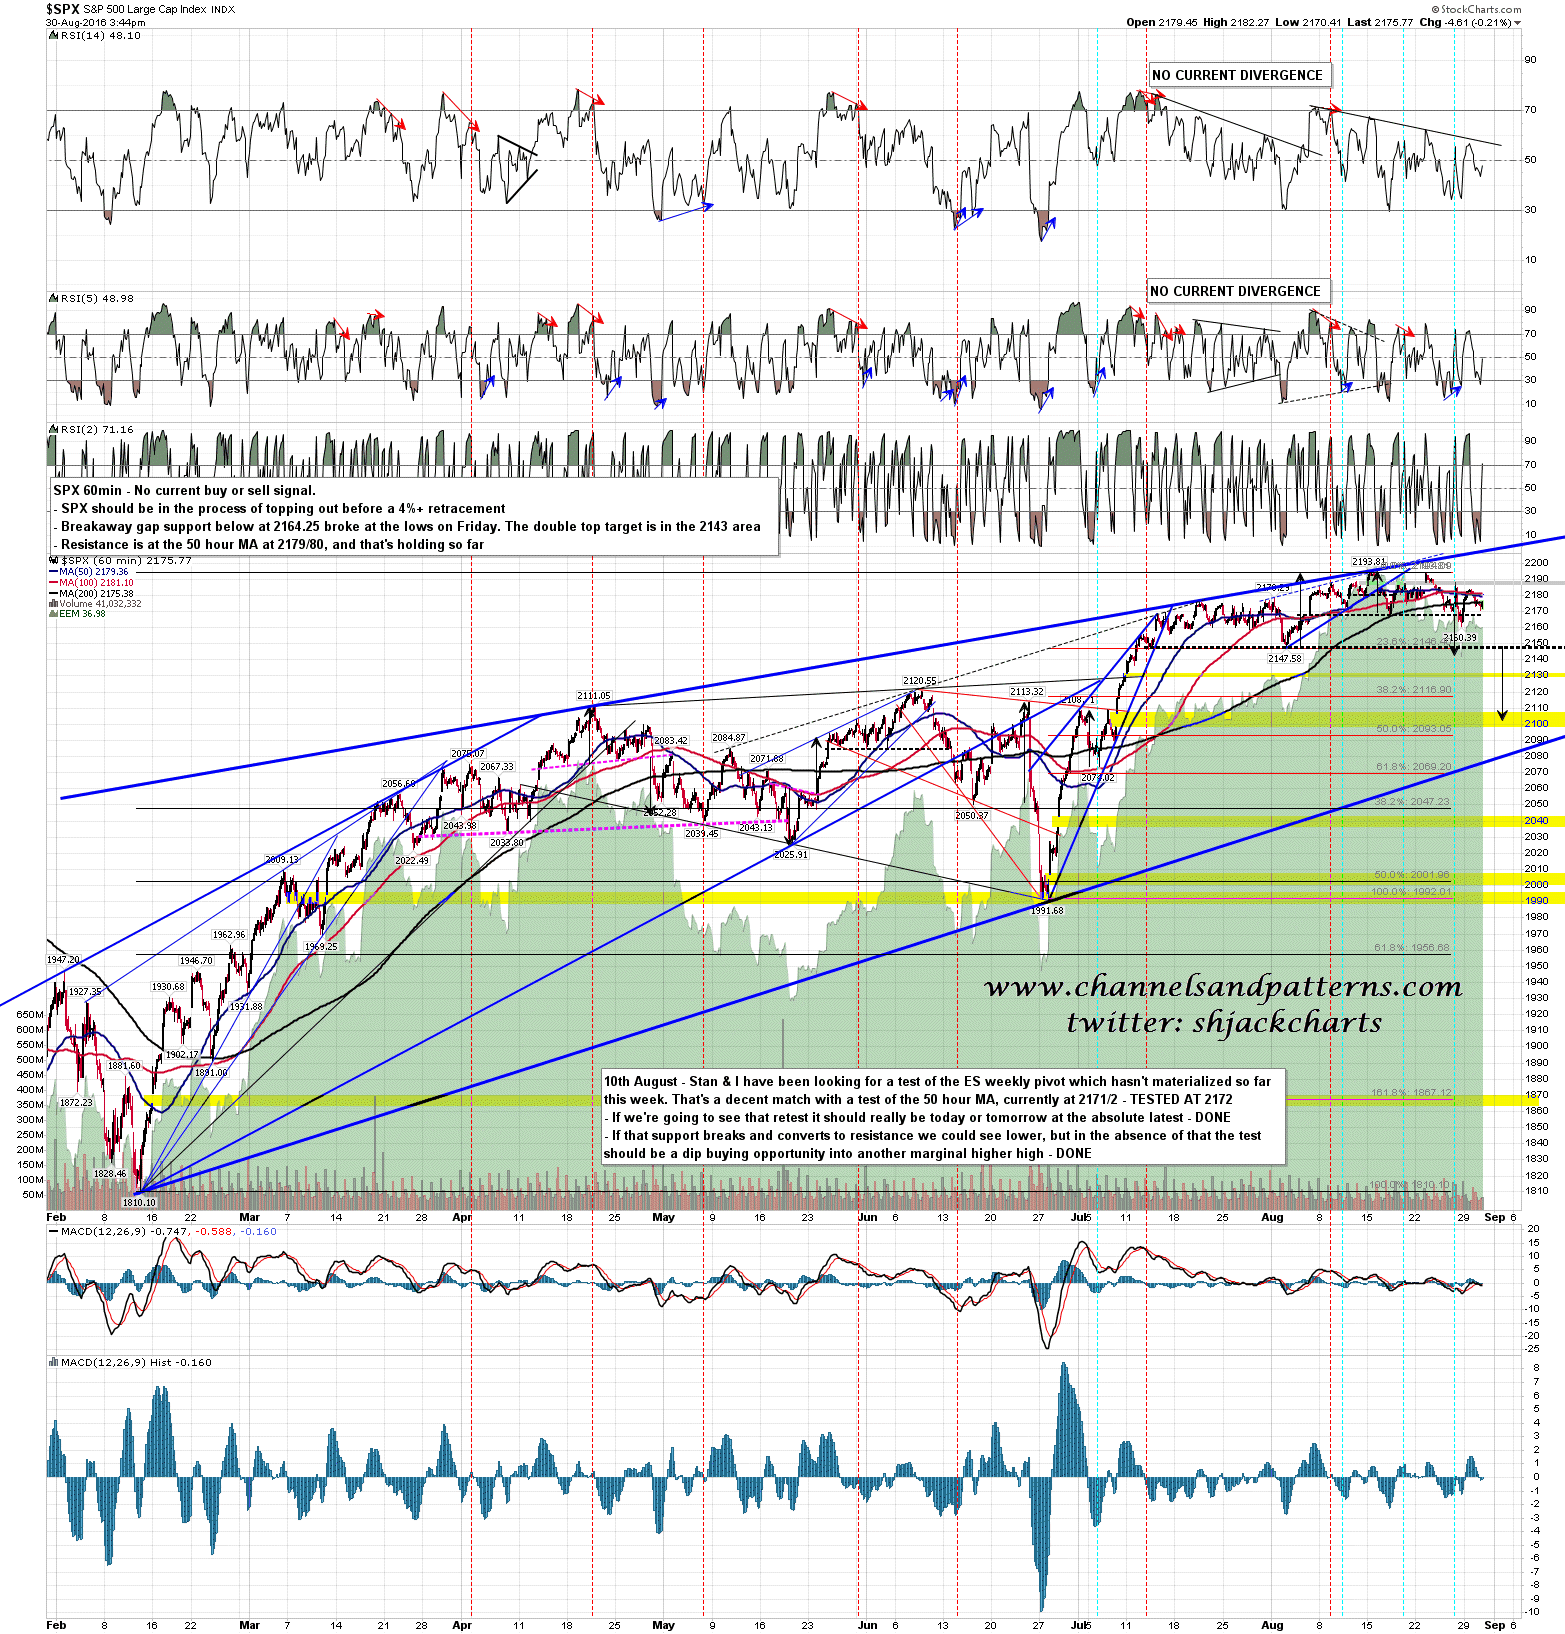
Another painfully slow afternoon on SPX, and the window to see a decent decline here is grinding by. So far SPX is holding the 50 hour MA at 2179/80 as resistance, and the close today was below the daily middle band at 2179, so yesterday’s minor break above was negated. The downside scenario hasn’t been killed off by bullishness yet, but I’m concerned that time is running out. SPX 60min chart:
SPX 1min chart:
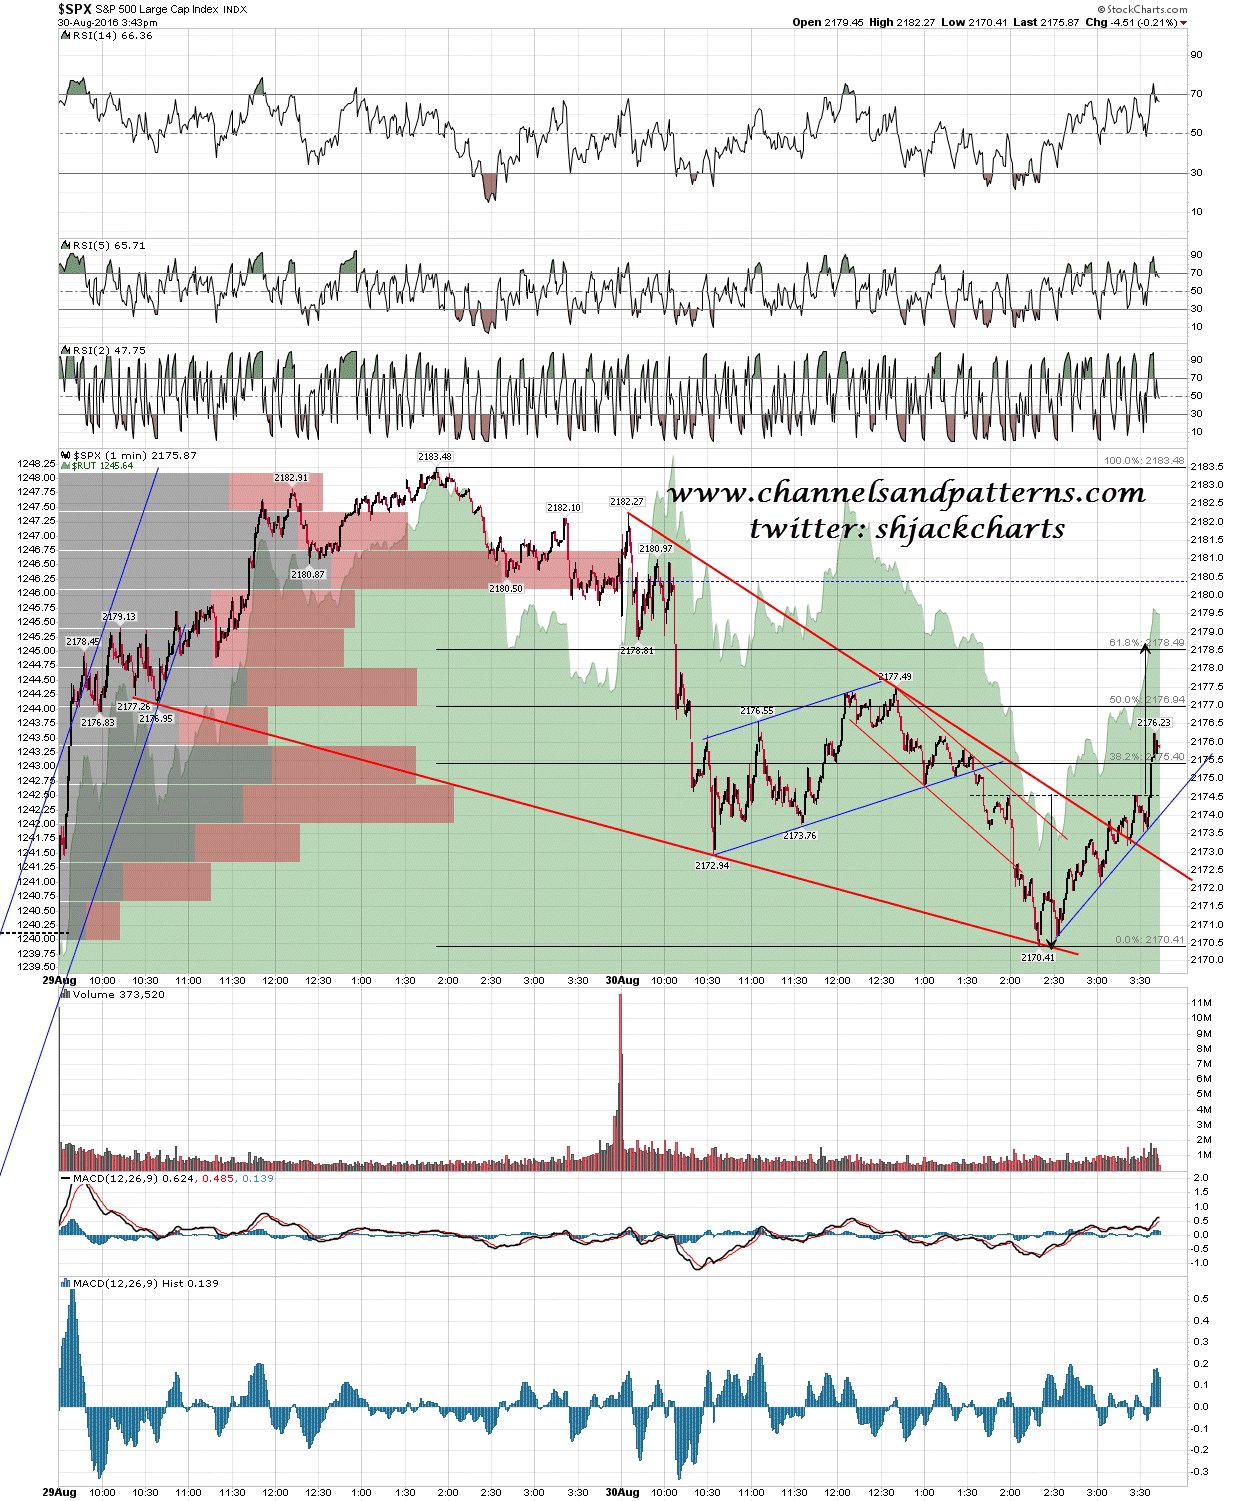
I’m wondering about a triangle here. Yesterday was a lower high and today was a higher low. If this is a triangle then as and when it breaks it would likely break up into at least a retest of the high. Bears may get another try tomorrow, but if we see a break over 2183.48 at this stage then we might well see a retest of the all time high, and very possibly higher. If that happens then this very boring tape may extend well into September
