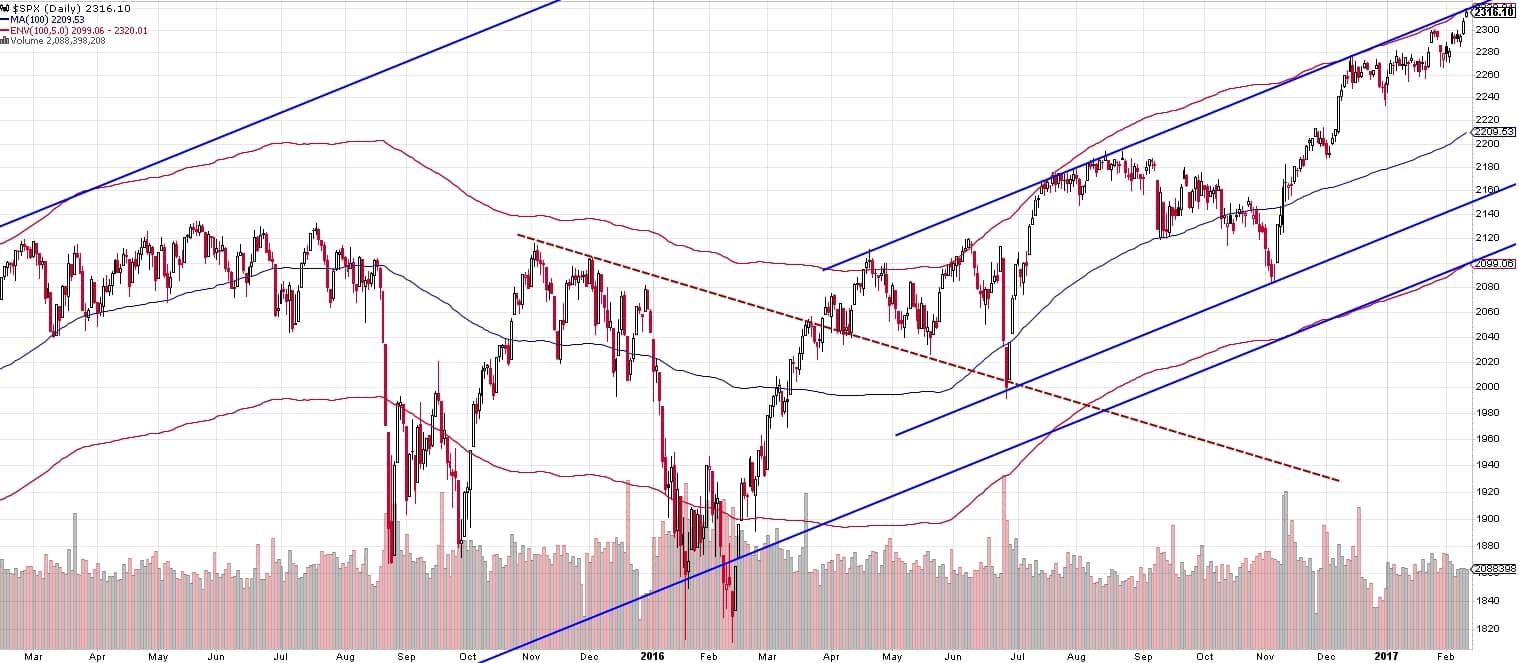
Before I get into the Trade Idea, I’m going to review the context of the S&P500 from a structural standpoint and a typical deviation standpoint. First of all, structurally, the Weekly and Daily charts show higher highs and higher lows, the very definition of an uptrend. In November of 2016, the SPY completed a $20 wide trading channel of which currently price is a stone’s throw from its high resistance. The channel would suggest that buying potential is limited.
Now, anyone who hangs around the comments has seen that I use 5% simple moving average envelopes around a 100MA as a measure of movement potential (oversold, neutral, overbought). Where are we now? Yep, hit it on Friday. Again. (Click on any chart to see a larger version).