
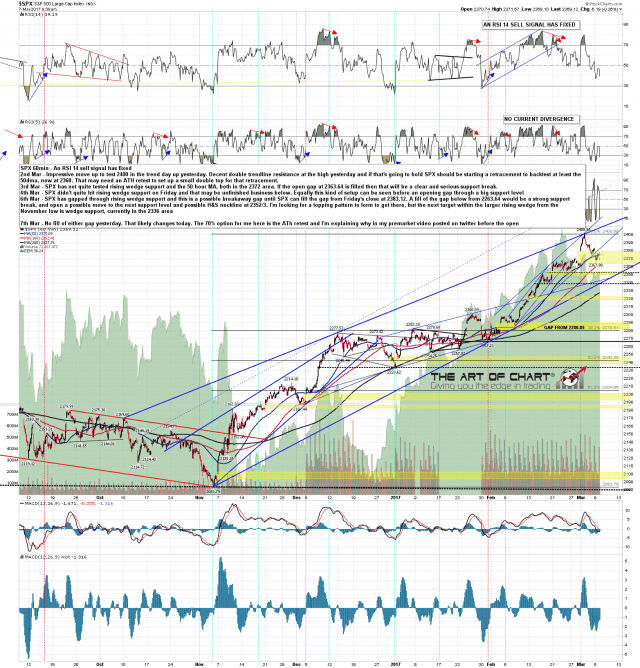
Nice decline on SPX yesterday morning, which didn’t fill the open gap support into 2363.64, and a nice rally in the afternoon, that didn’t fill the open (possibly breakaway) gap resistance into Friday’s close at 2383.12. The opening setup here is 70% bullish falling wedges breaking up on all of SPX, ES, NDX, NQ and RUT, TF. I posted my premarket video that I record every morning for Daily Video Service subscribers at theartofchart.net on my twitter this morning before the open to show the setup, and you can see that video here. SPX 60min chart:
There is obviously an open daily RSI 5 sell signal fixed on SPX, also both RSI 14 and RSI 5 sell signals on RUT, and both RSI 14 and RSI 5 sell signals fixed on NDX yesterday. There is a lot of downward pressure and I’d note that while I feel that the ATH retest next is the 70/30 option here, Stan is leaning in the other direction that 70/30 the swing highs have already been made. SPX may break down here, but until that gap support fills I’m favoring a break up into an ATH retest first to make a likely second high of a double top. SPX daily chart:

Nice falling wedge bull flag setup. Key resistance at the weekly pivot at 2379.75, which needs to be converted to support to open the ATH retest. ES Mar 60min (pre-market) chart:

Nice falling wedge bull flag setup. Key resistance at the weekly pivot at 5363.25, which needs to be converted to support to open the ATH retest. NQ Mar 60min (pre-market) chart:

Nice falling wedge setup. Key resistance at the weekly and monthly pivots at at 1395/6, which need to be converted to support to open the ATH retest. TF Mar 60min (pre-market) chart:

This is the key inflection point for the week here and if SPX breaks up we should see that ATH retest. If SPX breaks down we may well see a fast move to the next trendline support, currently in the 2337 area.
