Remarkably SPX/ES is still in the same inflection point it was yesterday afternoon. I had expected to see some resolution either up or down on ES overnight but no, so both targets are still in play at either the strong support zone at 2368-72 SPX with rising wedge support, the ES weekly pivot, the 50 hour MA and the daily middle band, or a retest of the rally high at 2390. I’m expecting to see one of those targets hit today and and am leaning bearish, though without any great conviction. SPX 60min chart:
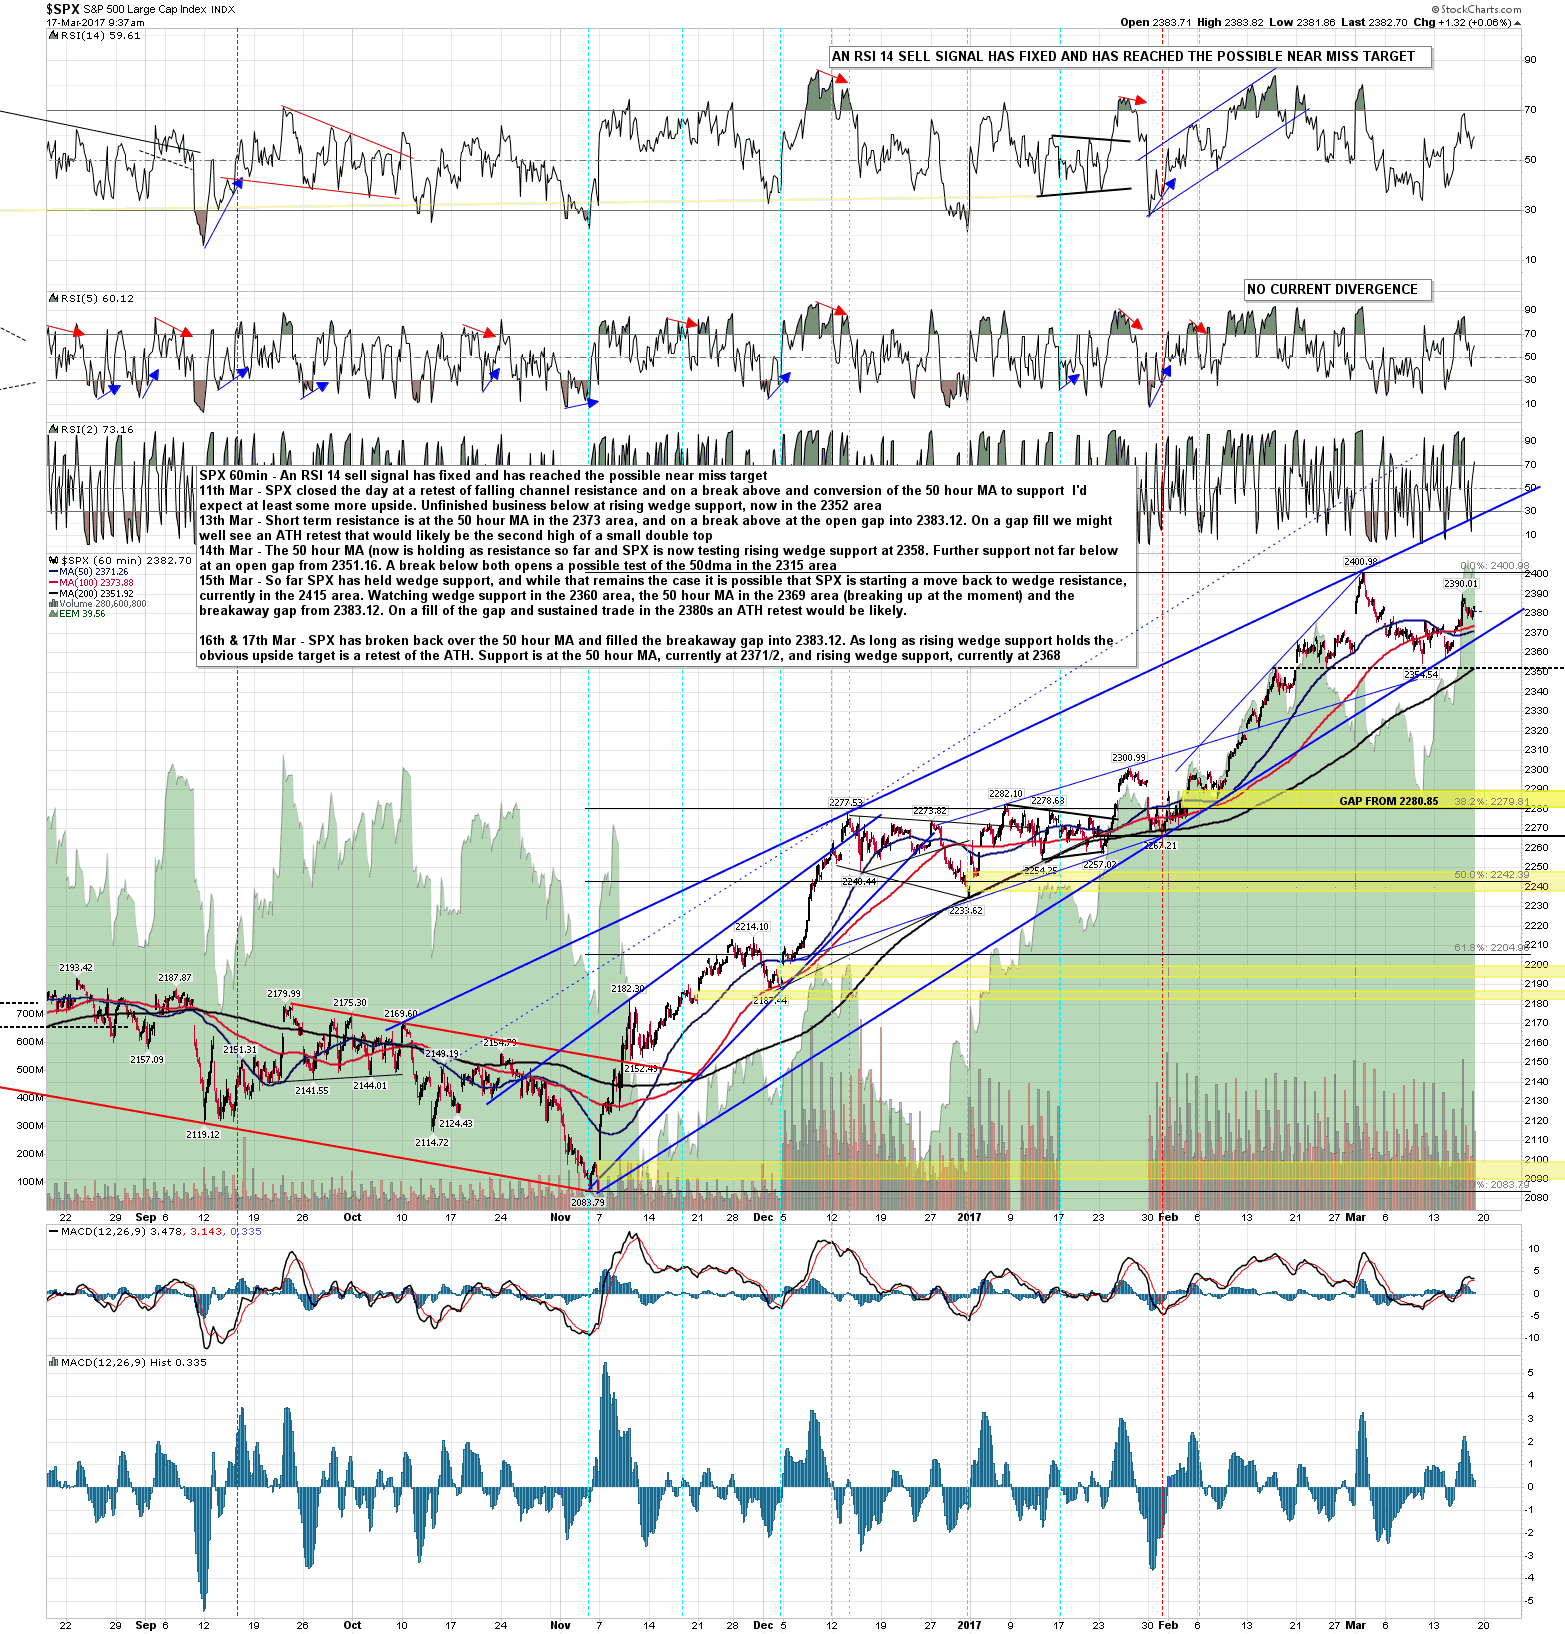
Daily upper keltner band resistance is still at 2391 and SPX is still on a daily RSI 5 sell signal. SPX daily chart:

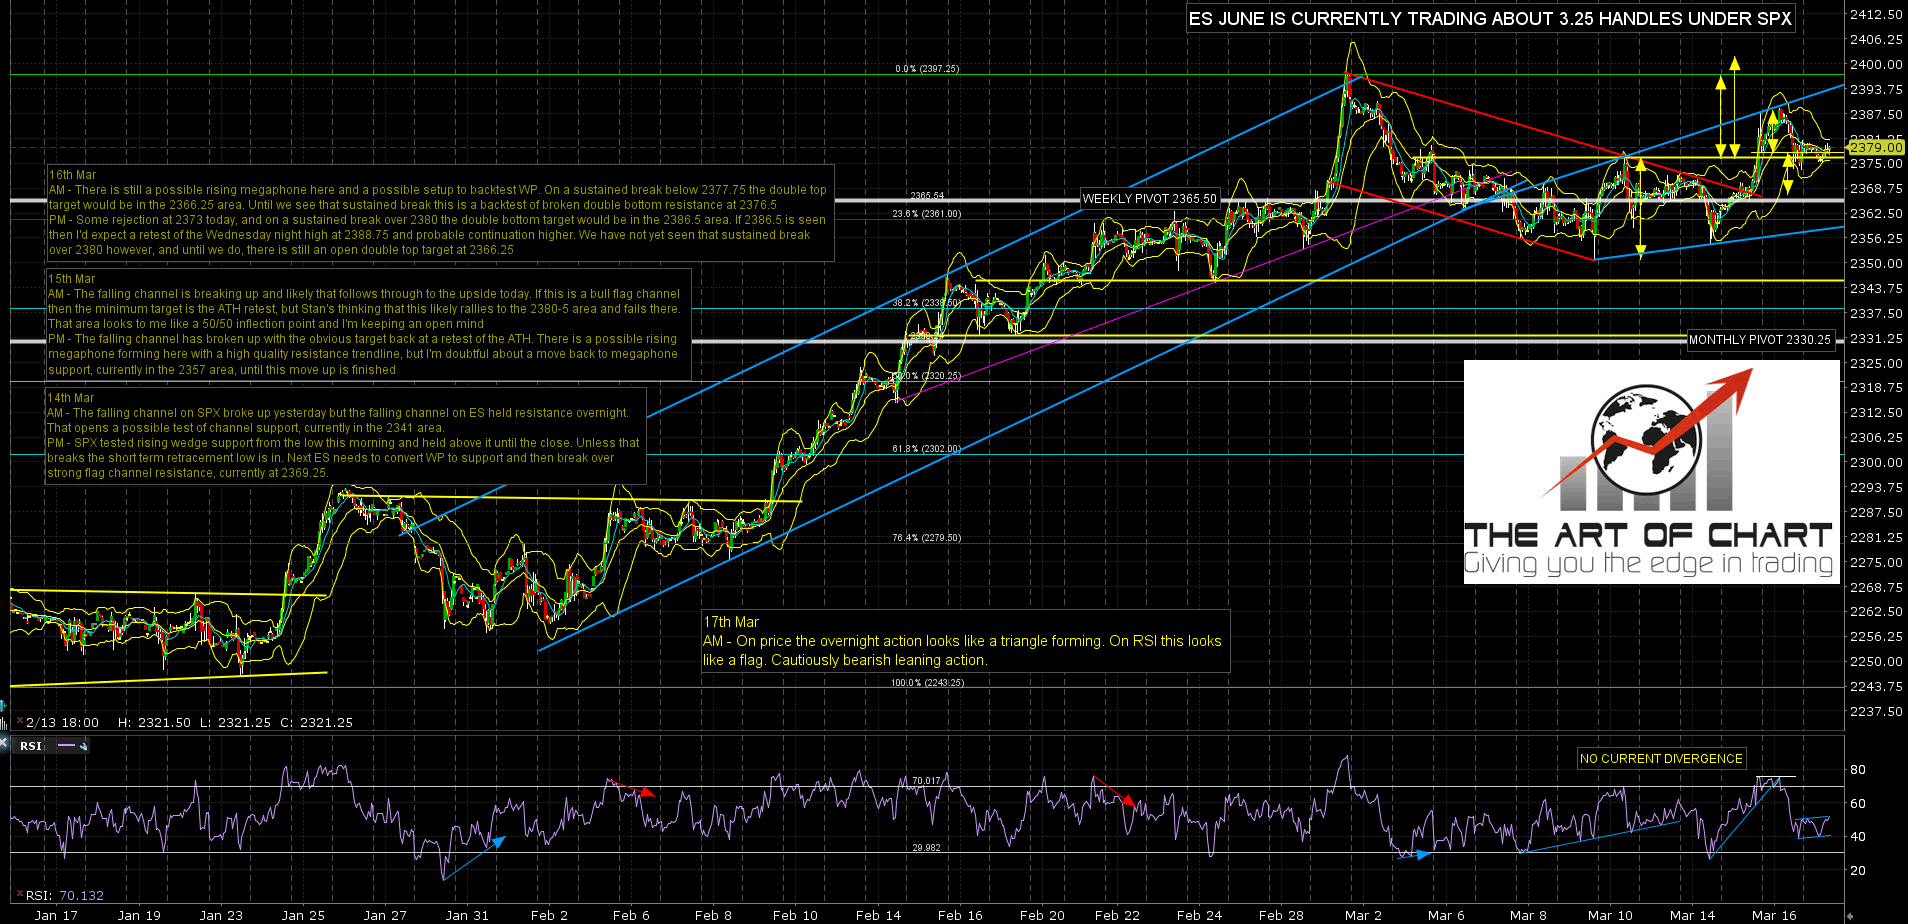
The ES action overnight cautiously looks like a bear flag forming. ES Jun 60min chart:
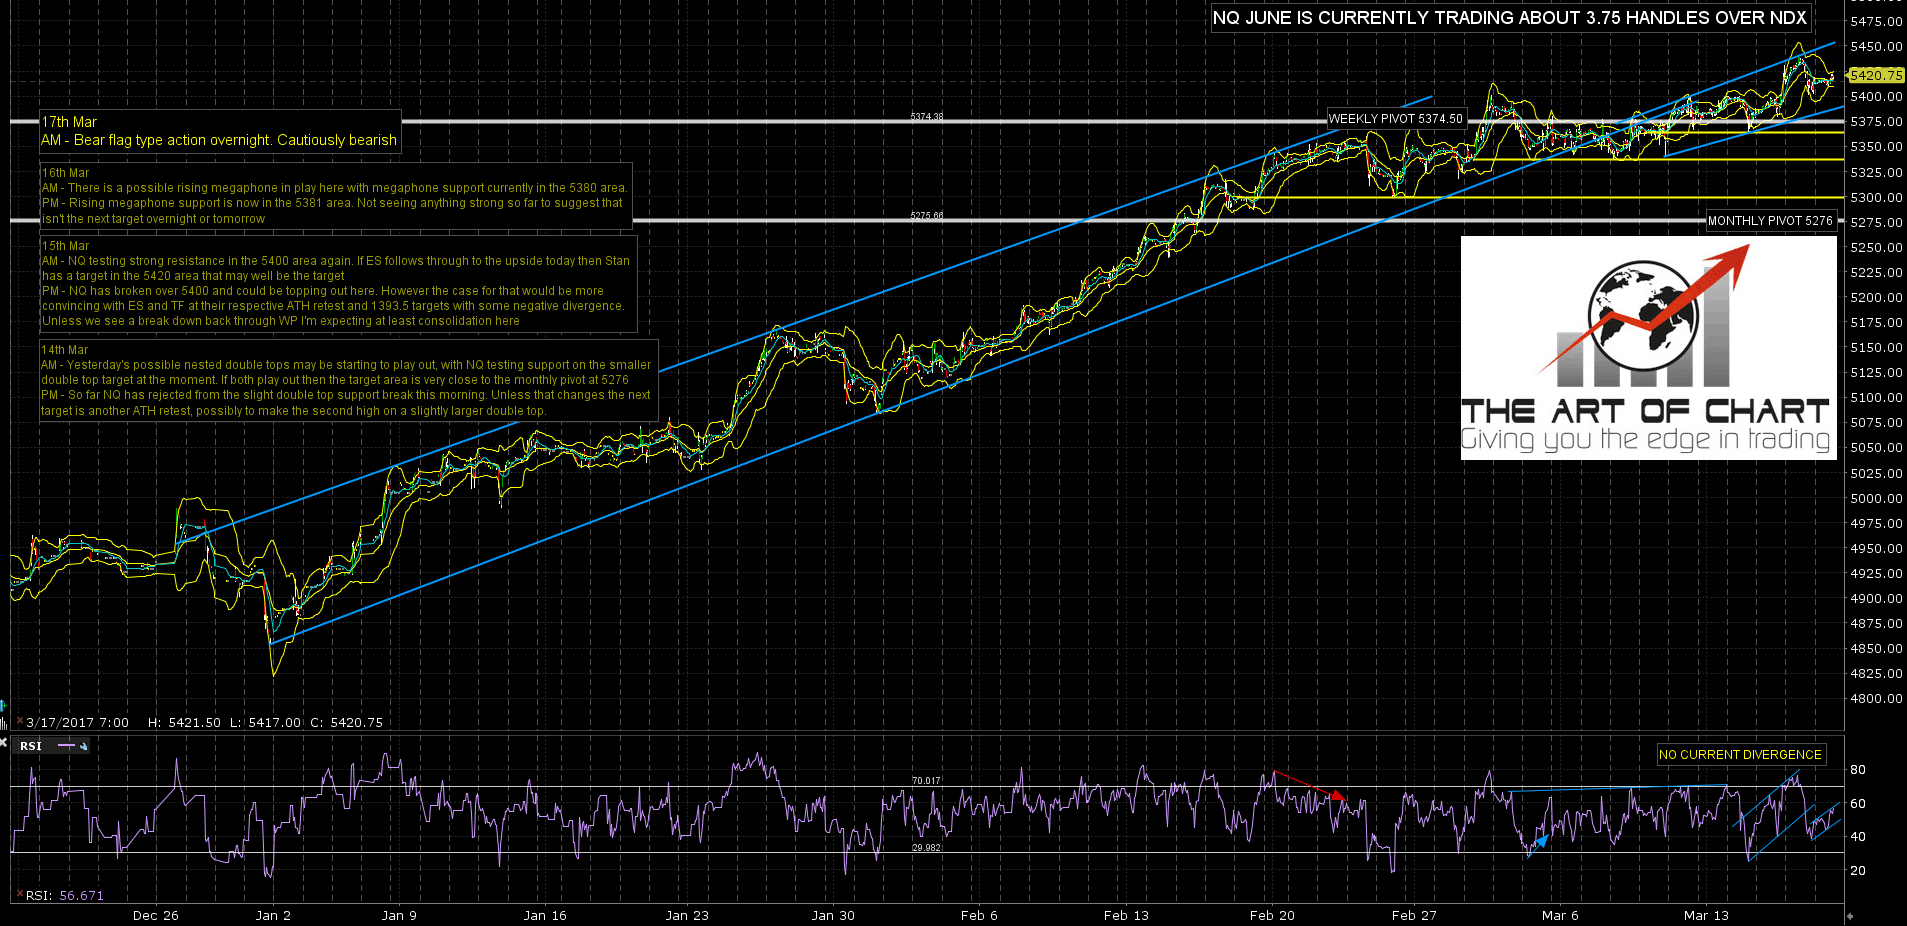
The NQ action overnight also cautiously looks like a bear flag forming. NQ Jun 60min chart:
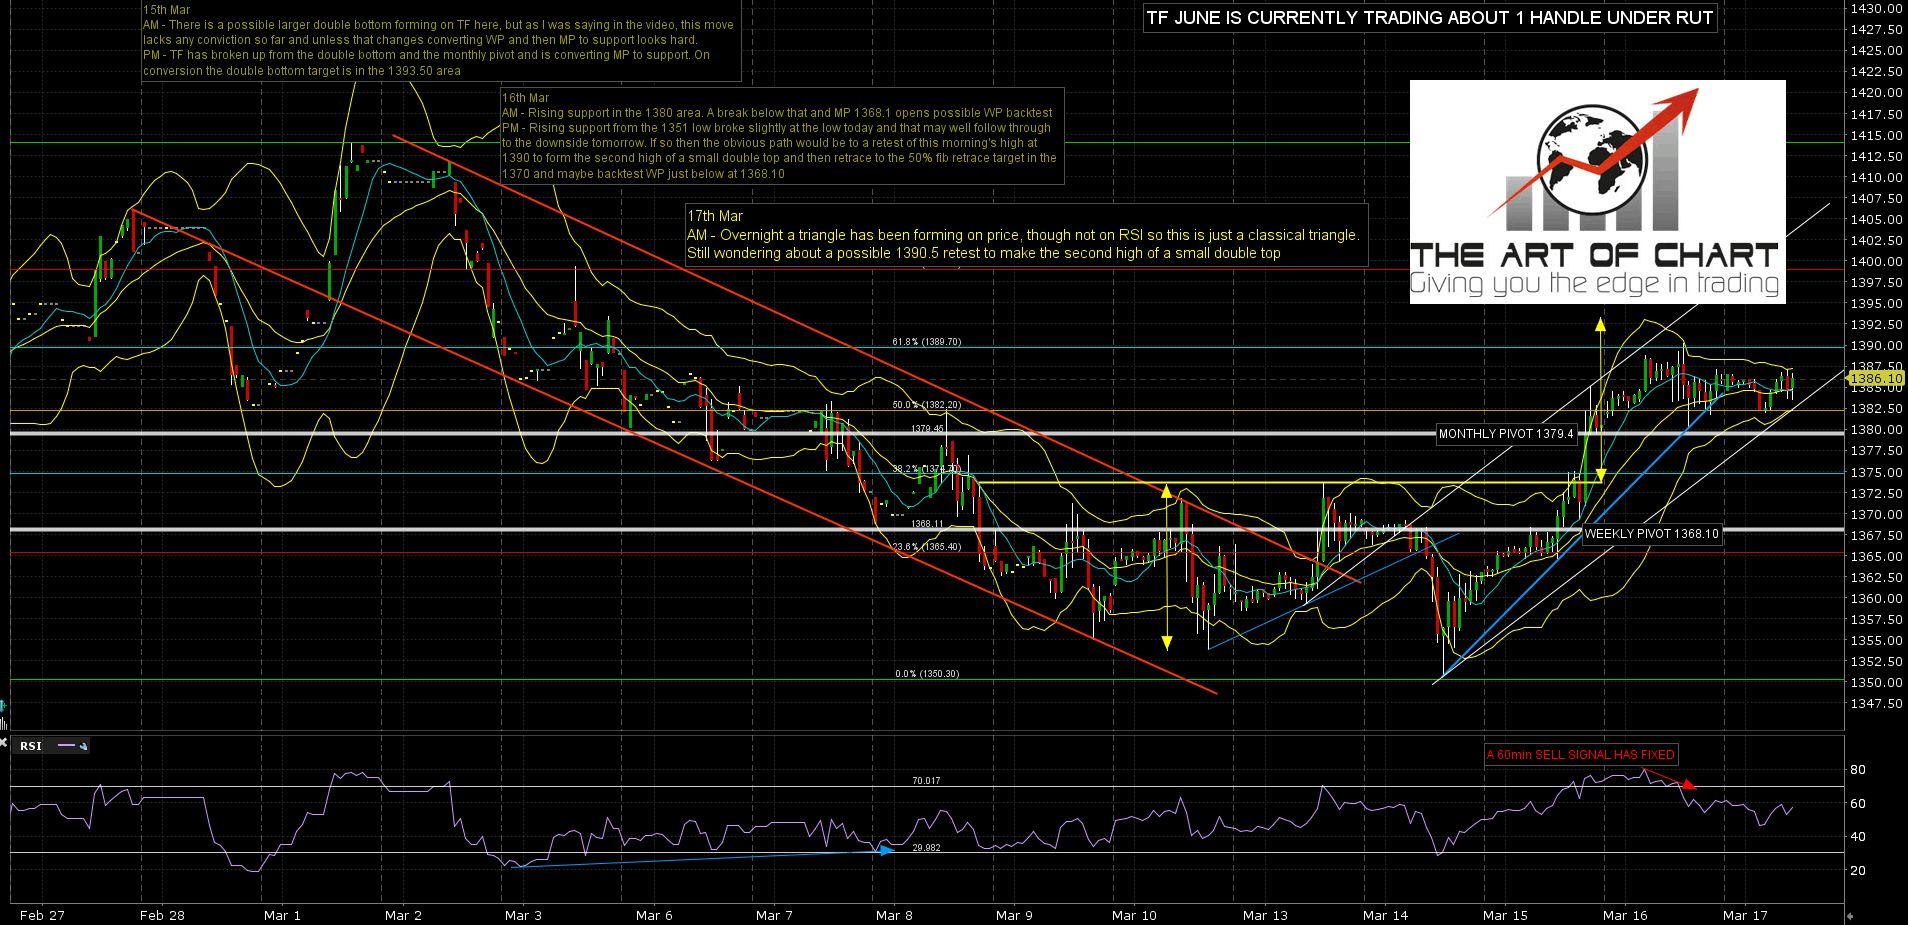
TF made a slightly lower high under 1390.5 and rejected there to test the monthly pivot as support. That could be a double top breaking down slightly at the AM low so far, but until the monthly pivot at 1379.4 breaks with some conviction the setup looks more like a bull flag. TF Jun 60min chart:
Stan and I did a free public webinar yesterday on our big five stocks. If you missed that just click the image below and that will take you to our March Free Webinars page where the recording is posted. Everyone have a great weekend 🙂