
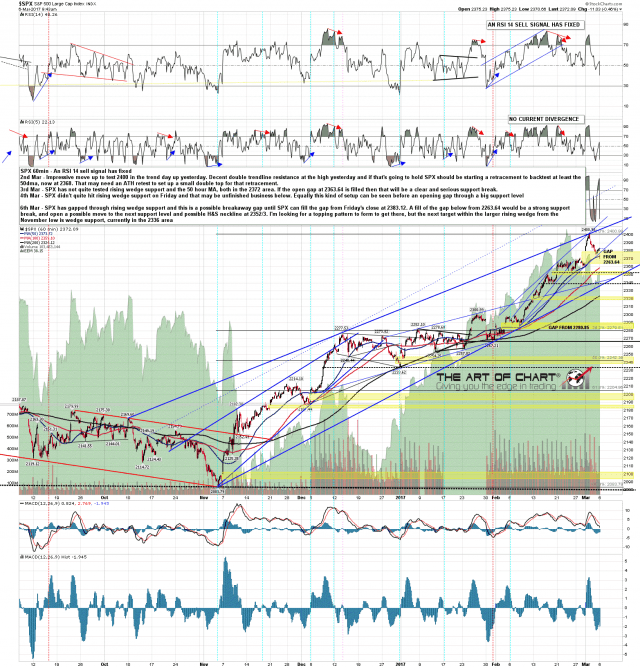
I was saying in our monthly public Chart Chat at theartofchart.net yesterday that the kind of setup we saw at the close on Friday sometimes resulted in an opening gap through support, and we have seen that on SPX this morning. If you’d like to see that the recording is posted on this page here.
This is a potential breakaway gap down and that is potentially very bearish until the gap from Friday’s close at 2383.12 is filled. Below there is strong gap support from 2363.64 and a break below that opens lower targets, with the first of those being the next open gap below just under the possible H&S neckline in the 2352/3 area. The main trendline target now is larger rising wedge support, currently in the 2336 area, but we would usually some a topping pattern for to take SPX lower, and I don’t see one yet. The hourly RSI 14 sell signal is not close to making target. SPX 60min chart:
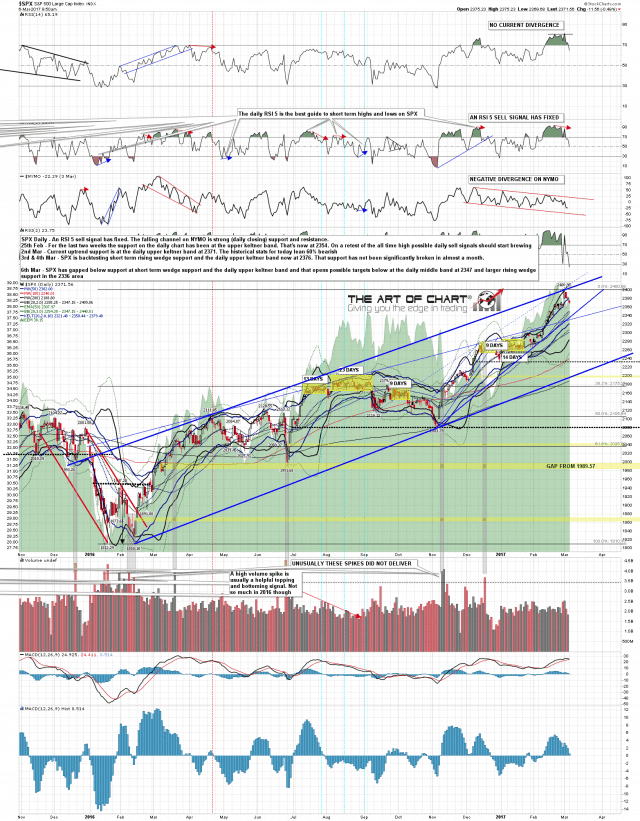
On the daily chart the open RSI 5 sell signal is even further short of target than the hourly chart signal and the gap through support at the upper keltner band opens lower targets, mainly the middle (bollinger) band at 2347 and larger rising wedge support in the 2336 area. That said I wouldn’t be at all surprised to see a retest of the ATH from here to make the second high of a small double top and if the breakaway gap above fills then I’d expect to see that. SPX daily chart:
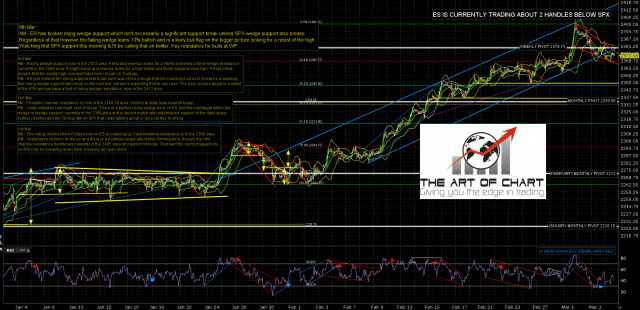
I was looking at the bullish leaning falling wedge formed on ES that would likely be a bull flag on the bigger picture and that is still looking just fine, with the addition of a small possible double bottom that would look for the 2384.5 area on a sustained break back above 2376.5. Key resistance is at the weekly pivot at 2379.75. ES Mar 60min (pre-market) chart:
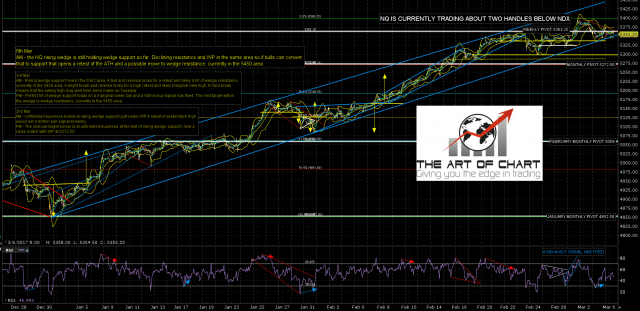
NQ has now broken rising wedge support and is stalling at a support floor in the 5343-5 area. Key resistance above is at the weekly pivot at 5363 and on a break above and conversion to support the obvious target would be an ATH retest there too. NQ Mar 60min (pre-market) chart:
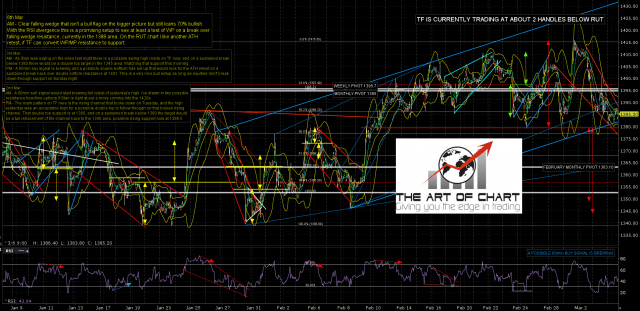
The falling wedge on TF (not a bull flag on bigger picture) still also looks fine. Falling wedge resistance is now in the 1387 area and a break above would open a test of the weekly pivot at 1395. TF Mar 60min (pre-market) chart:
The bears want a trend down day today and at the time of writing they might get it. On SPX the key level is the open gap from 2363.64, and if that gap is filled the lower targets open up.
