I was saying in our monthly public Chart Chat at theartofchart.net yesterday that the kind of setup we saw at the close on Friday sometimes resulted in an opening gap through support, and we have seen that on SPX this morning. If you’d like to see that the recording is posted on this page here.
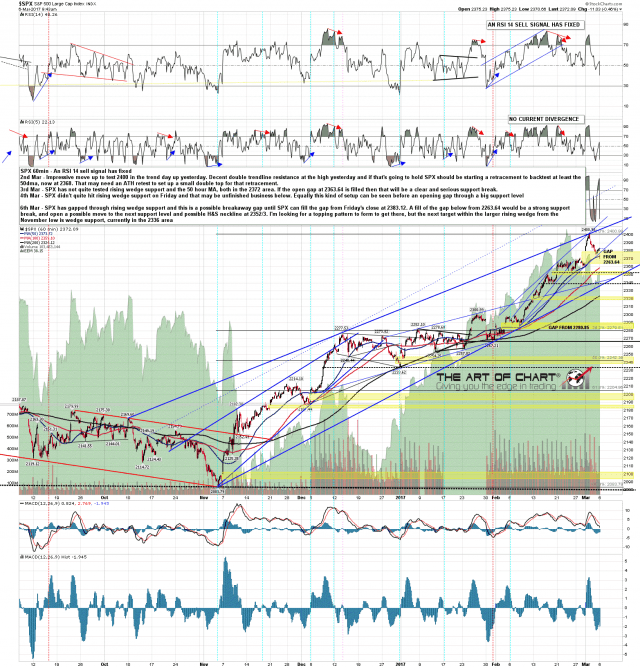
This is a potential breakaway gap down and that is potentially very bearish until the gap from Friday’s close at 2383.12 is filled. Below there is strong gap support from 2363.64 and a break below that opens lower targets, with the first of those being the next open gap below just under the possible H&S neckline in the 2352/3 area. The main trendline target now is larger rising wedge support, currently in the 2336 area, but we would usually some a topping pattern for to take SPX lower, and I don’t see one yet. The hourly RSI 14 sell signal is not close to making target. SPX 60min chart: