
I was saying yesterday that my preferred target for this rally would be a backtest of the daily middle band on SPX. That’s now at 2388.50 and the high today at the time of writing is at 2384.41, so obviously SPX is now in the backtest area. The 60min buy signals on the SPX, ES, NQ & TF charts have now all made target and this is an obvious inflection point. On a reversal back down here the next target on SPX is larger double top support at 2322. On a break above with confidence the obvious next target would be a retest of the ATH and likely marginal new ATH.
Are there reasons to think that bulls may drive SPX through resistance here? Yes there are. Firstly the action so far on SPX/ES is very trendy so far, and I have valid IHS patterns on ES, NQ & TF that are all pointing higher, though in the case of ES that’s only marginally higher to the weekly pivot at 2390.50.
SPX is now starting a test of the 61.8% fib retracement at 2385.50, and the daily middle band at 2388.50. SPX daily chart:
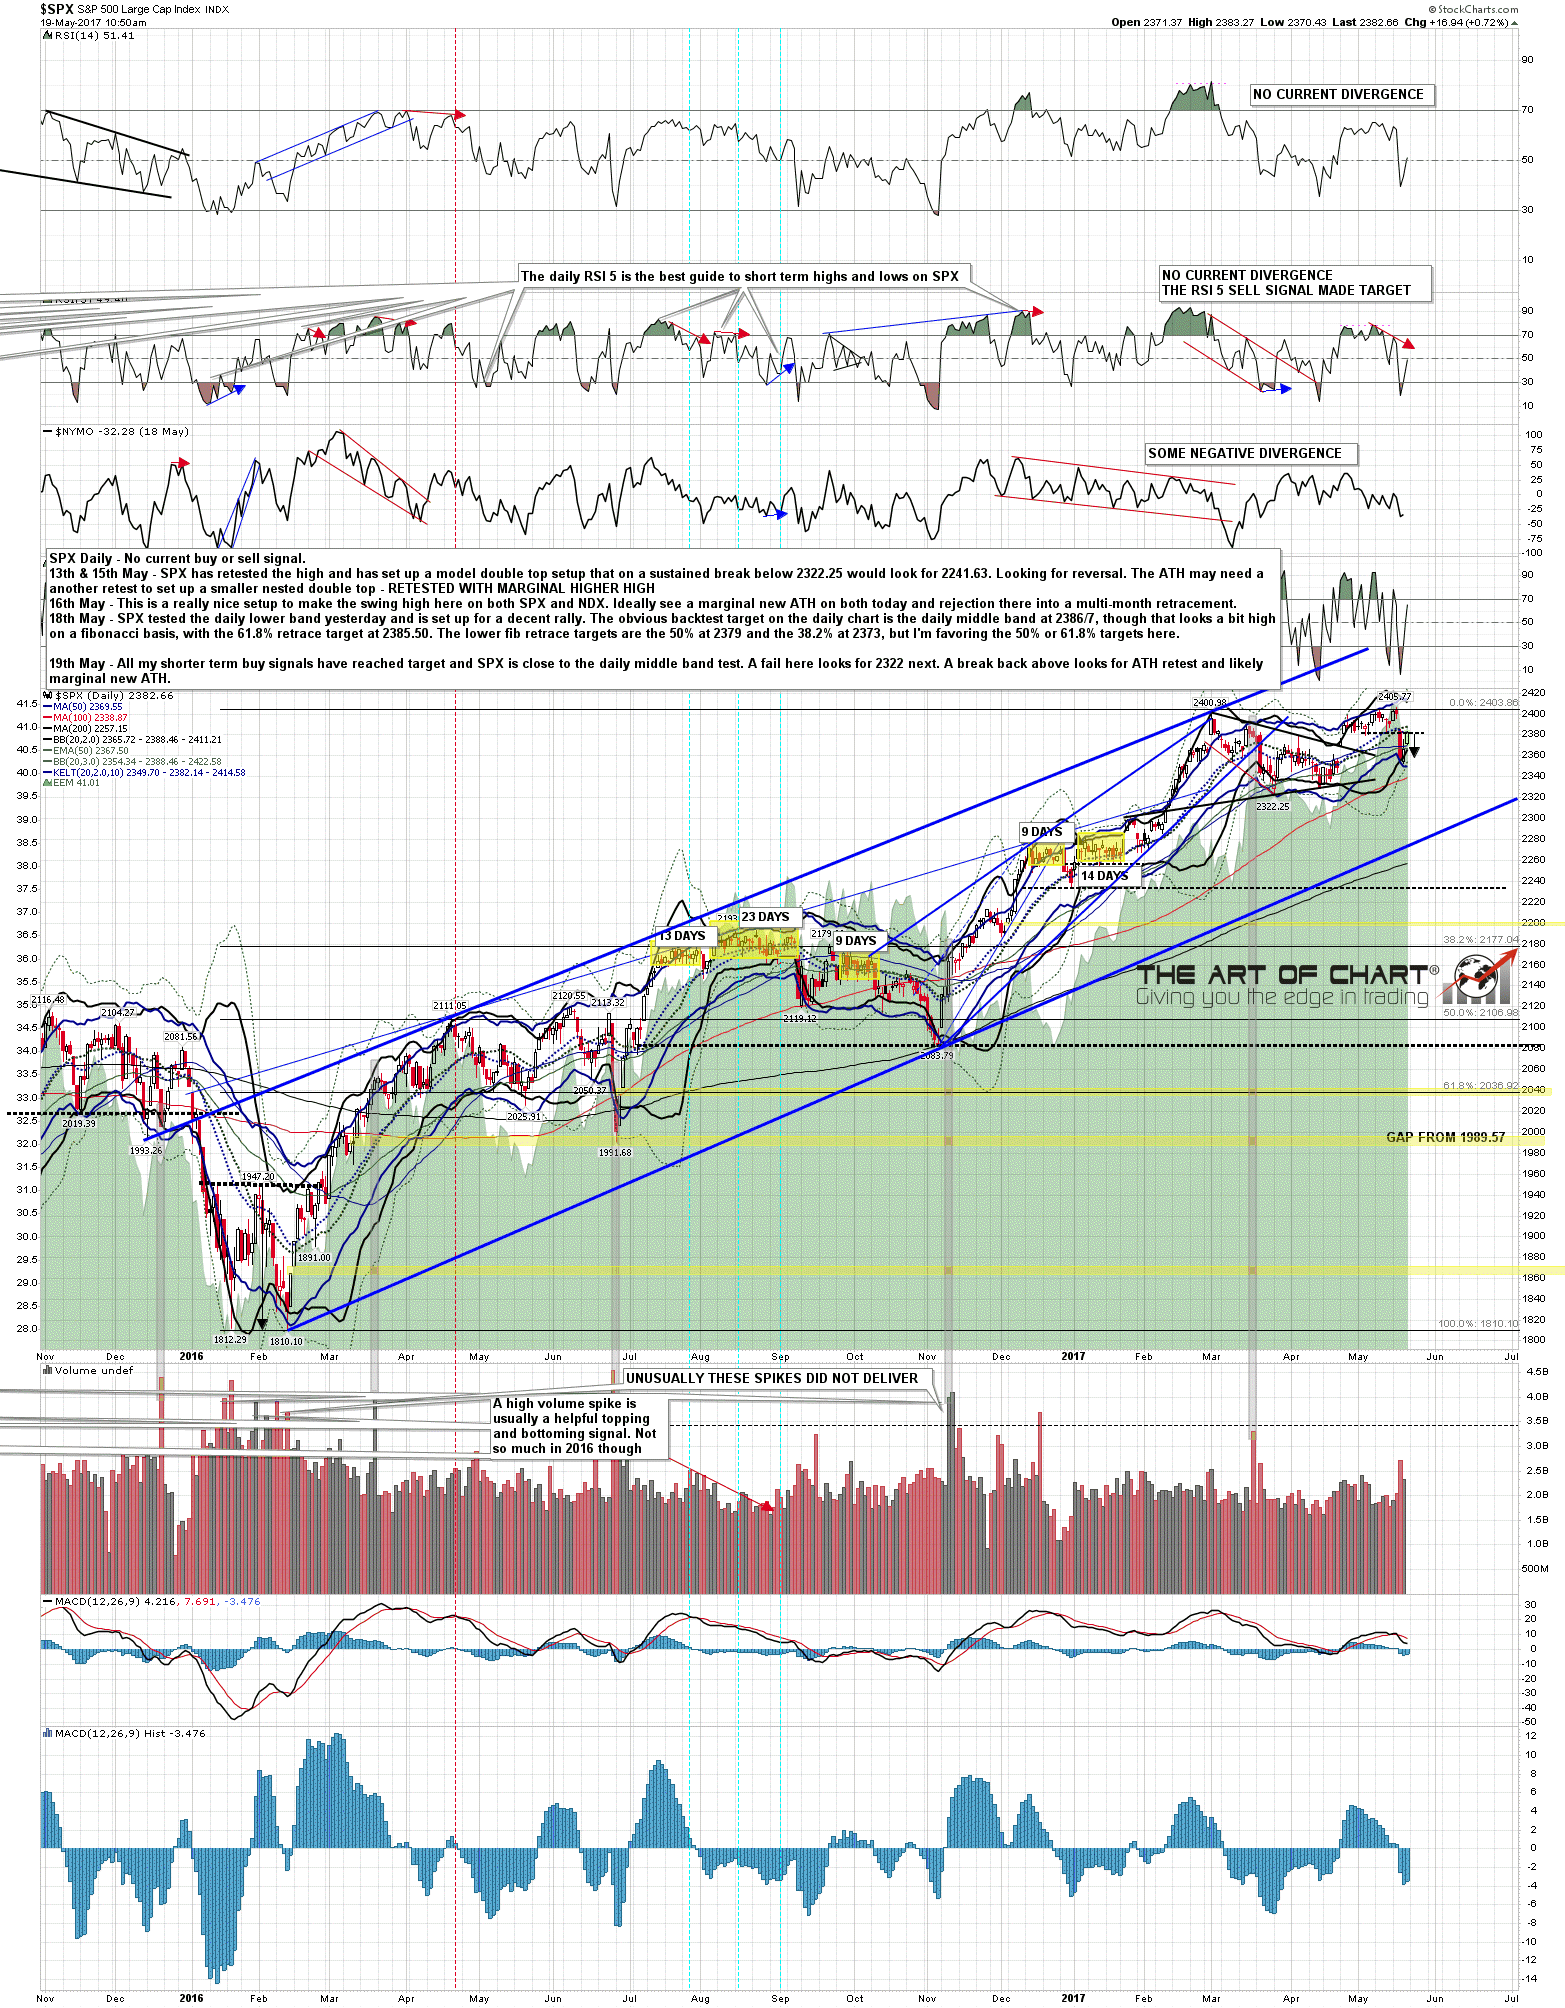
SPX is now slightly over the 5dma and backtest of broken trendline support but not significantly so far. These four levels at 5dma, trendline backtest, 61.8% fib and daily middle band are most of the resistance zone here with the fifth and last part slightly higher at the weekly pivot on ES at 2390.5. SPX daily 5dma chart:

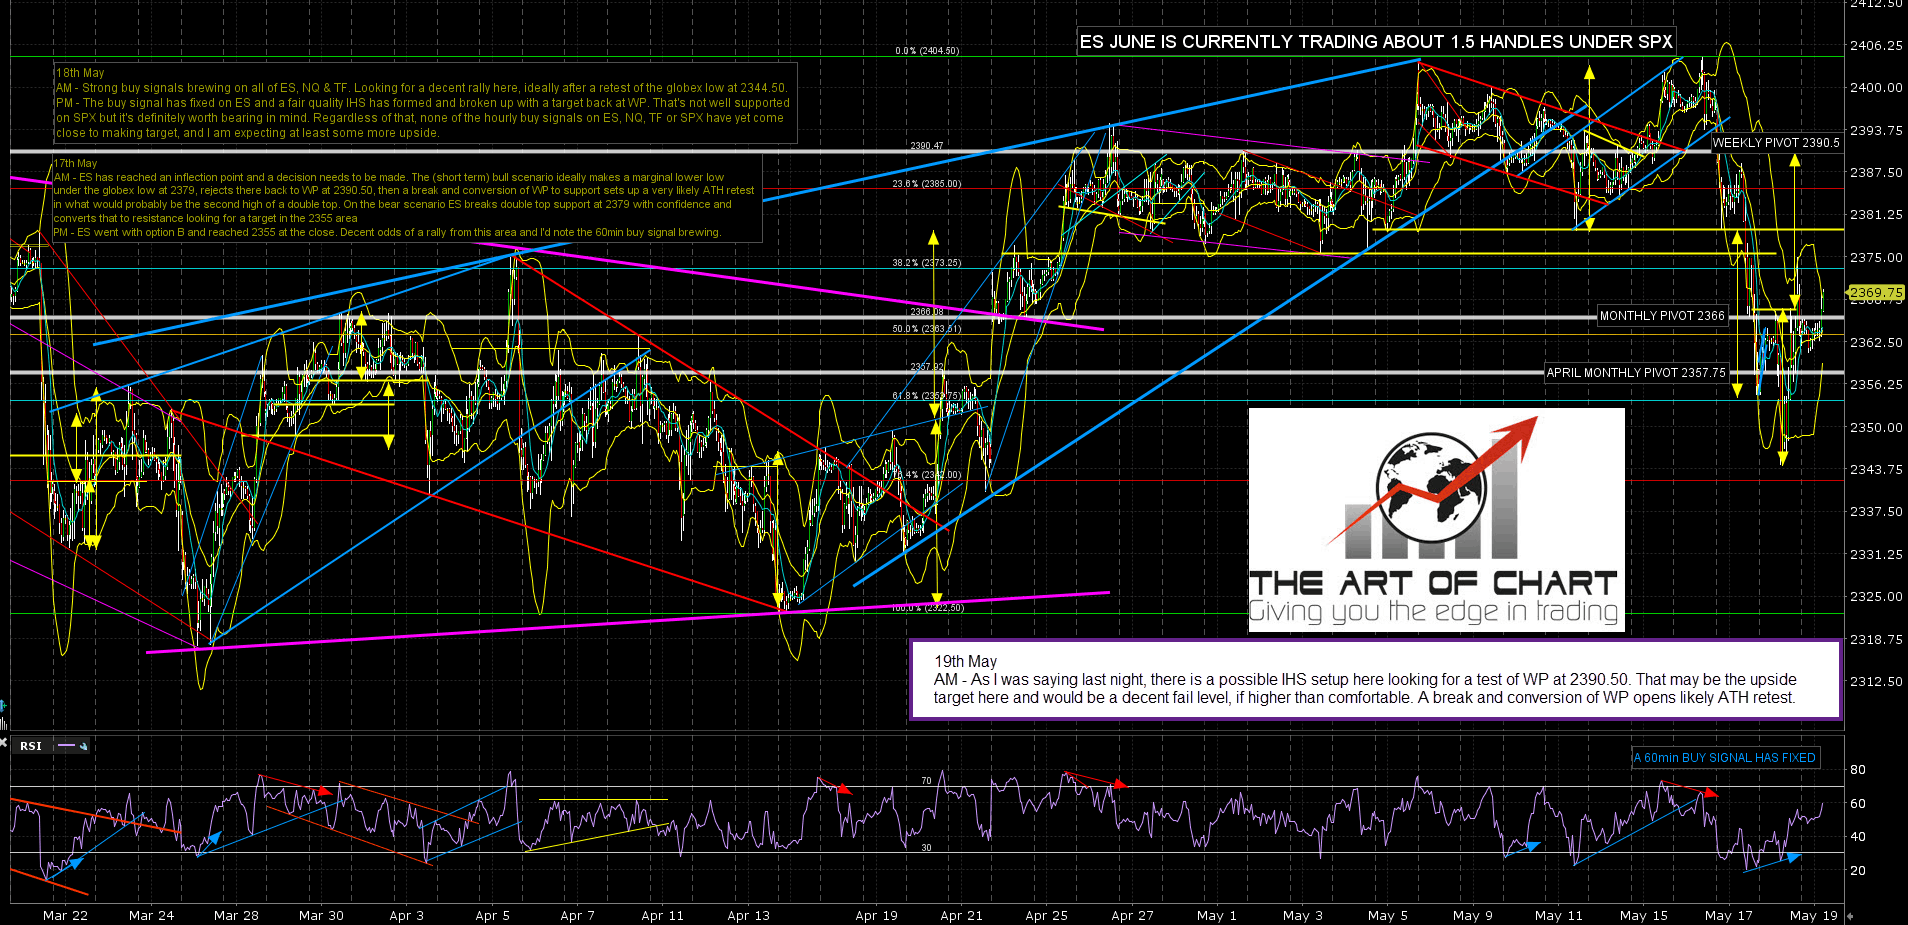
The ES and NQ futures charts below were done before the open for Daily Video Service subscribers at theartofchart.net. If you are interested in trying our services a 30 day free trial is available here.
On these futures charts I’d mention that I leave the notes on these for two or three days marked with the day and AM (premarket notes) and PM (post market notes), so you can usually look back if you want to. I’m mentioning this today because the notes from last night on the charts below are worth a look.
On ES the IHS target is at the retest of weekly pivot at 2390.5 (about 2391/2 SPX). That is the top of the inflection/resistance zone and a break above with conversion to support opens the ATH retest. ES Jun 60min chart:
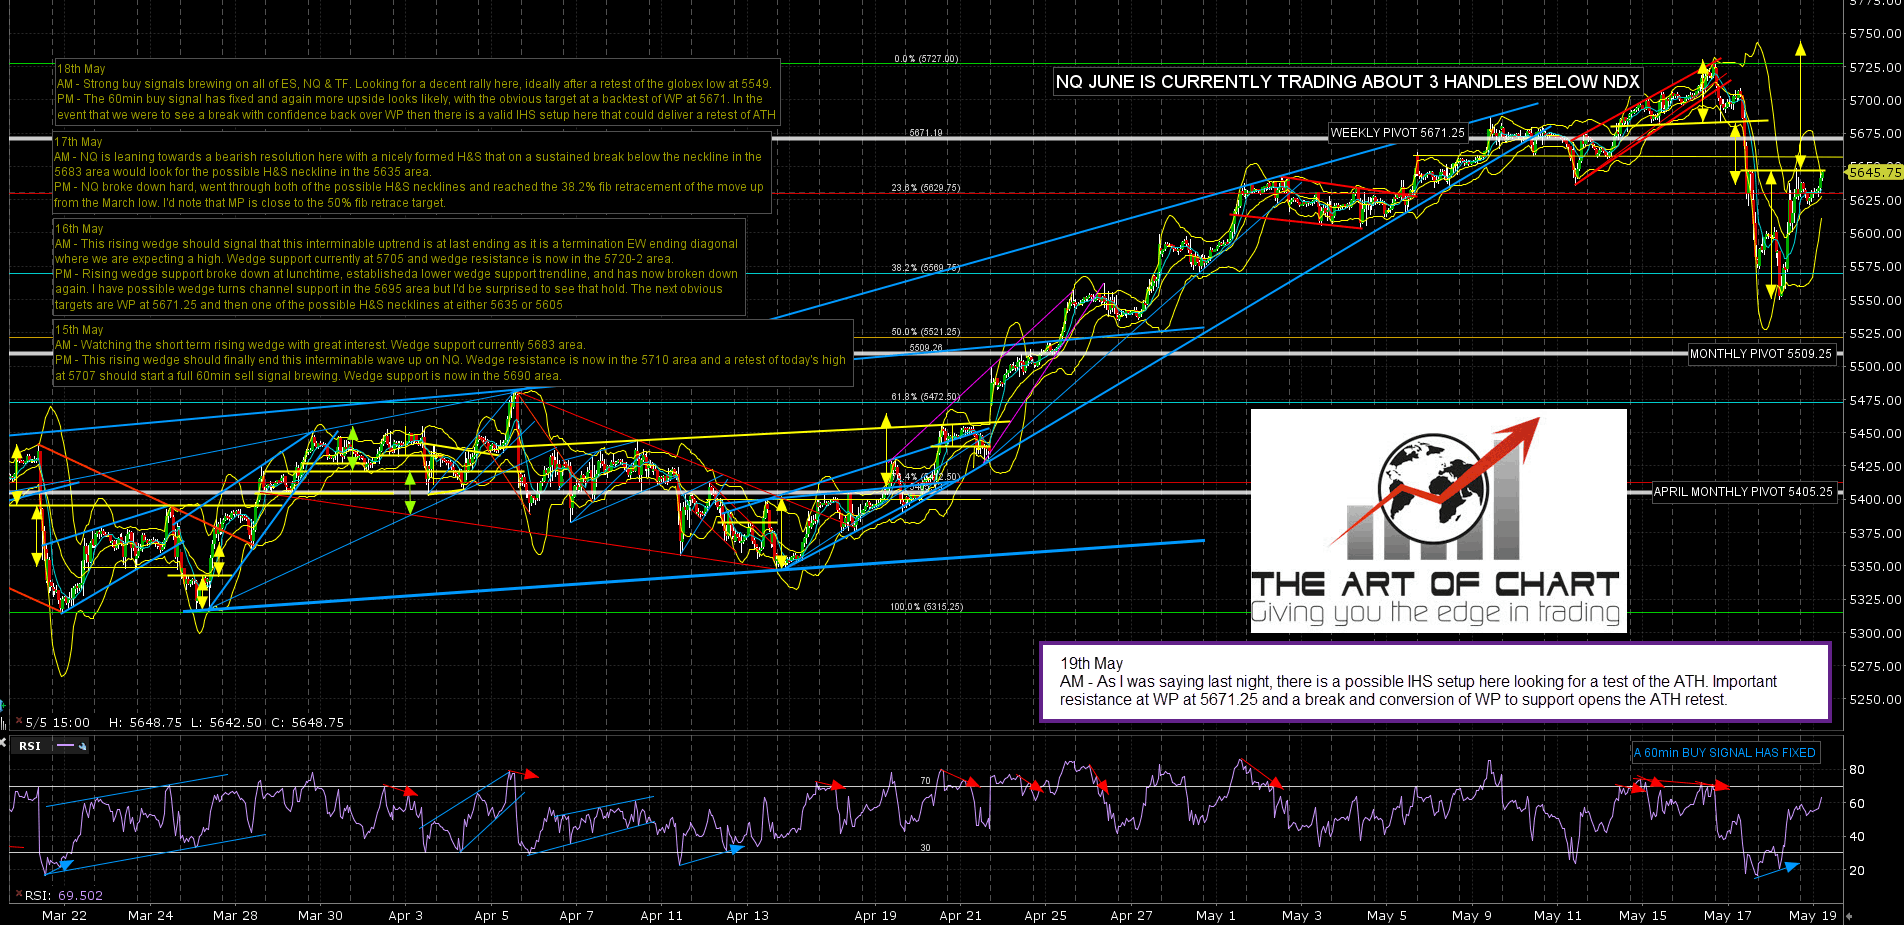
NQ is currently testing the resistance at weekly pivot there and that’s been holding for over two hours so far, though not with any clear rejection so far. The IHS on NQ has a target back at the ATH retest and if NQ is going to reverse back down without that ATH retest, this is the obvious place to do that, though it could still break above it and fail to convert it to support and fail from that failed break high. NQ Jun 60min chart:
The IHS target on TF is at 1381/2 and that likely doesn’t hit either unless resistance breaks on ES and NQ. TF Jun 60min chart:
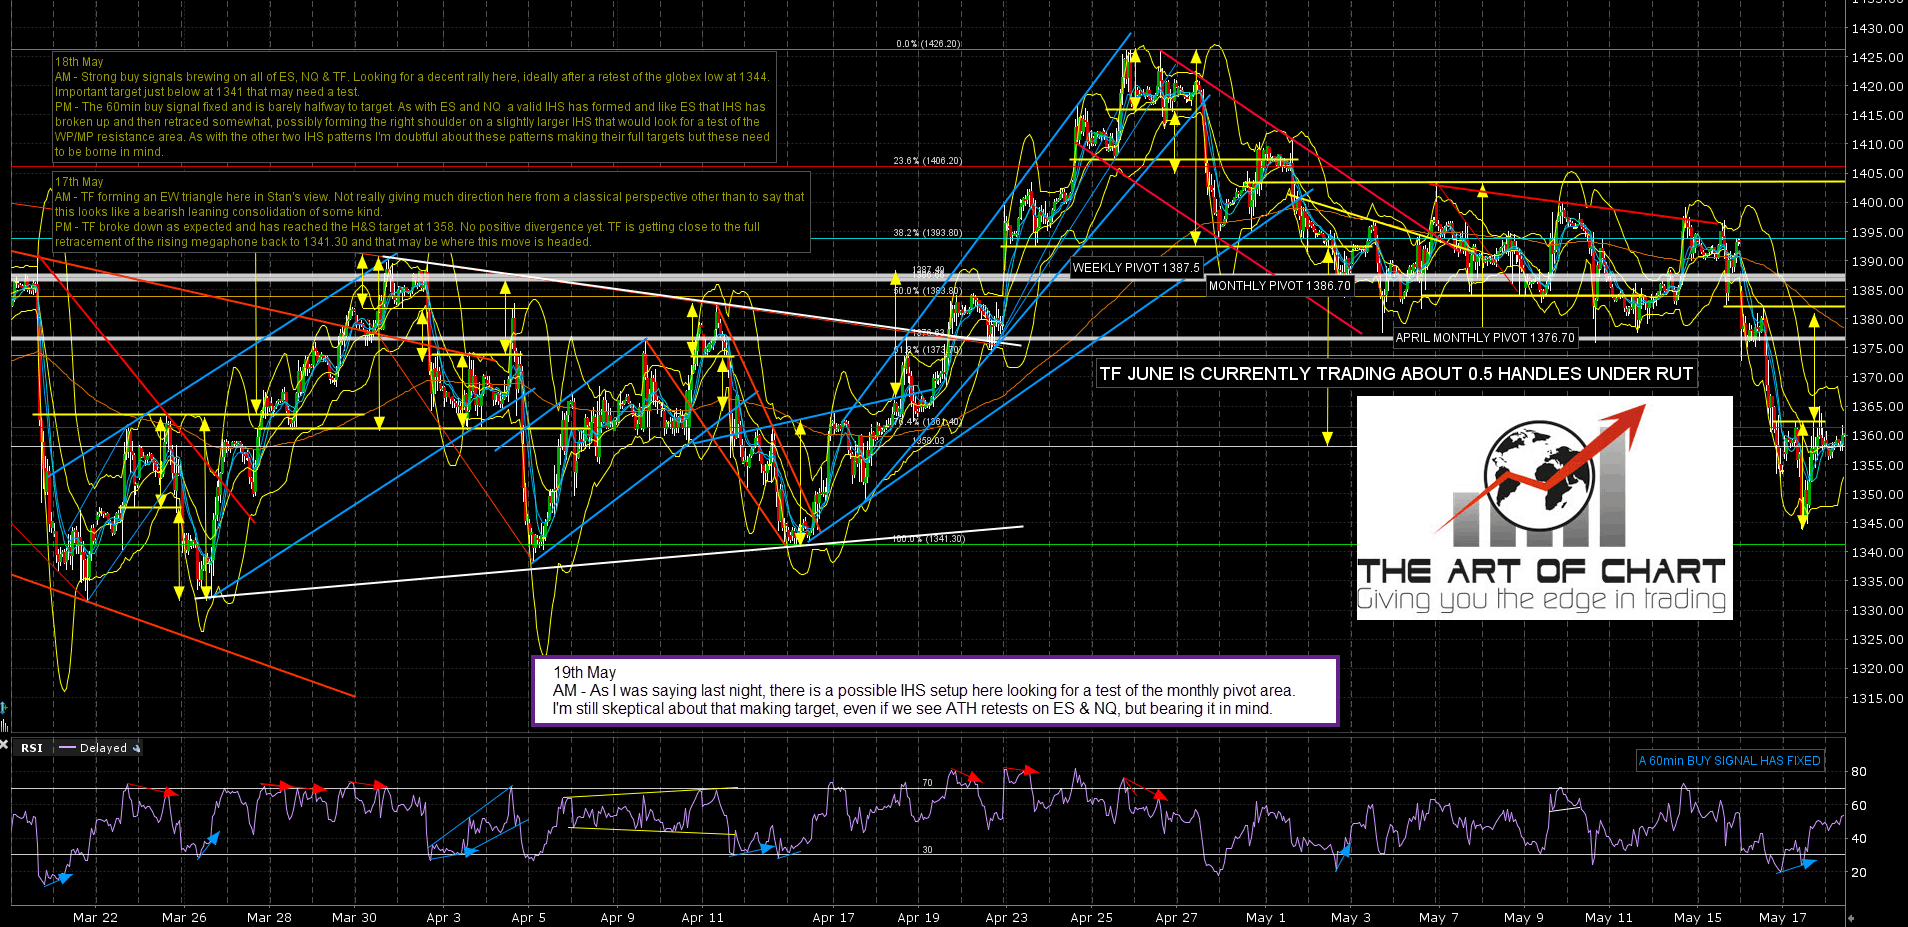
I’m leaning towards resistance holding today but wouldn’t be that surprised to see it break on this kind of approach today. A sustained break should deliver ATH retests on ES & NQ. If so I would note that there is nothing inherently bullish about high retests, and that some 70% of tops on SPX are some kind of double top.
Stan and I are doing a free public webinar at theartofchart.net an hour after the close next Thursday Trader Psychology in the second of our Managing Risk webinars, and if you’d like to attend then you can register for that on our May Free Webinars page. I would also note that this week’s edition of The Weekly Call is posted and that the model portfolio there is up 167% over the last six months, looking well on course to make our target minimum 200% return over the first year. That’s a free weekly service and if you trade futures I’d suggest adding it to your reading list.
