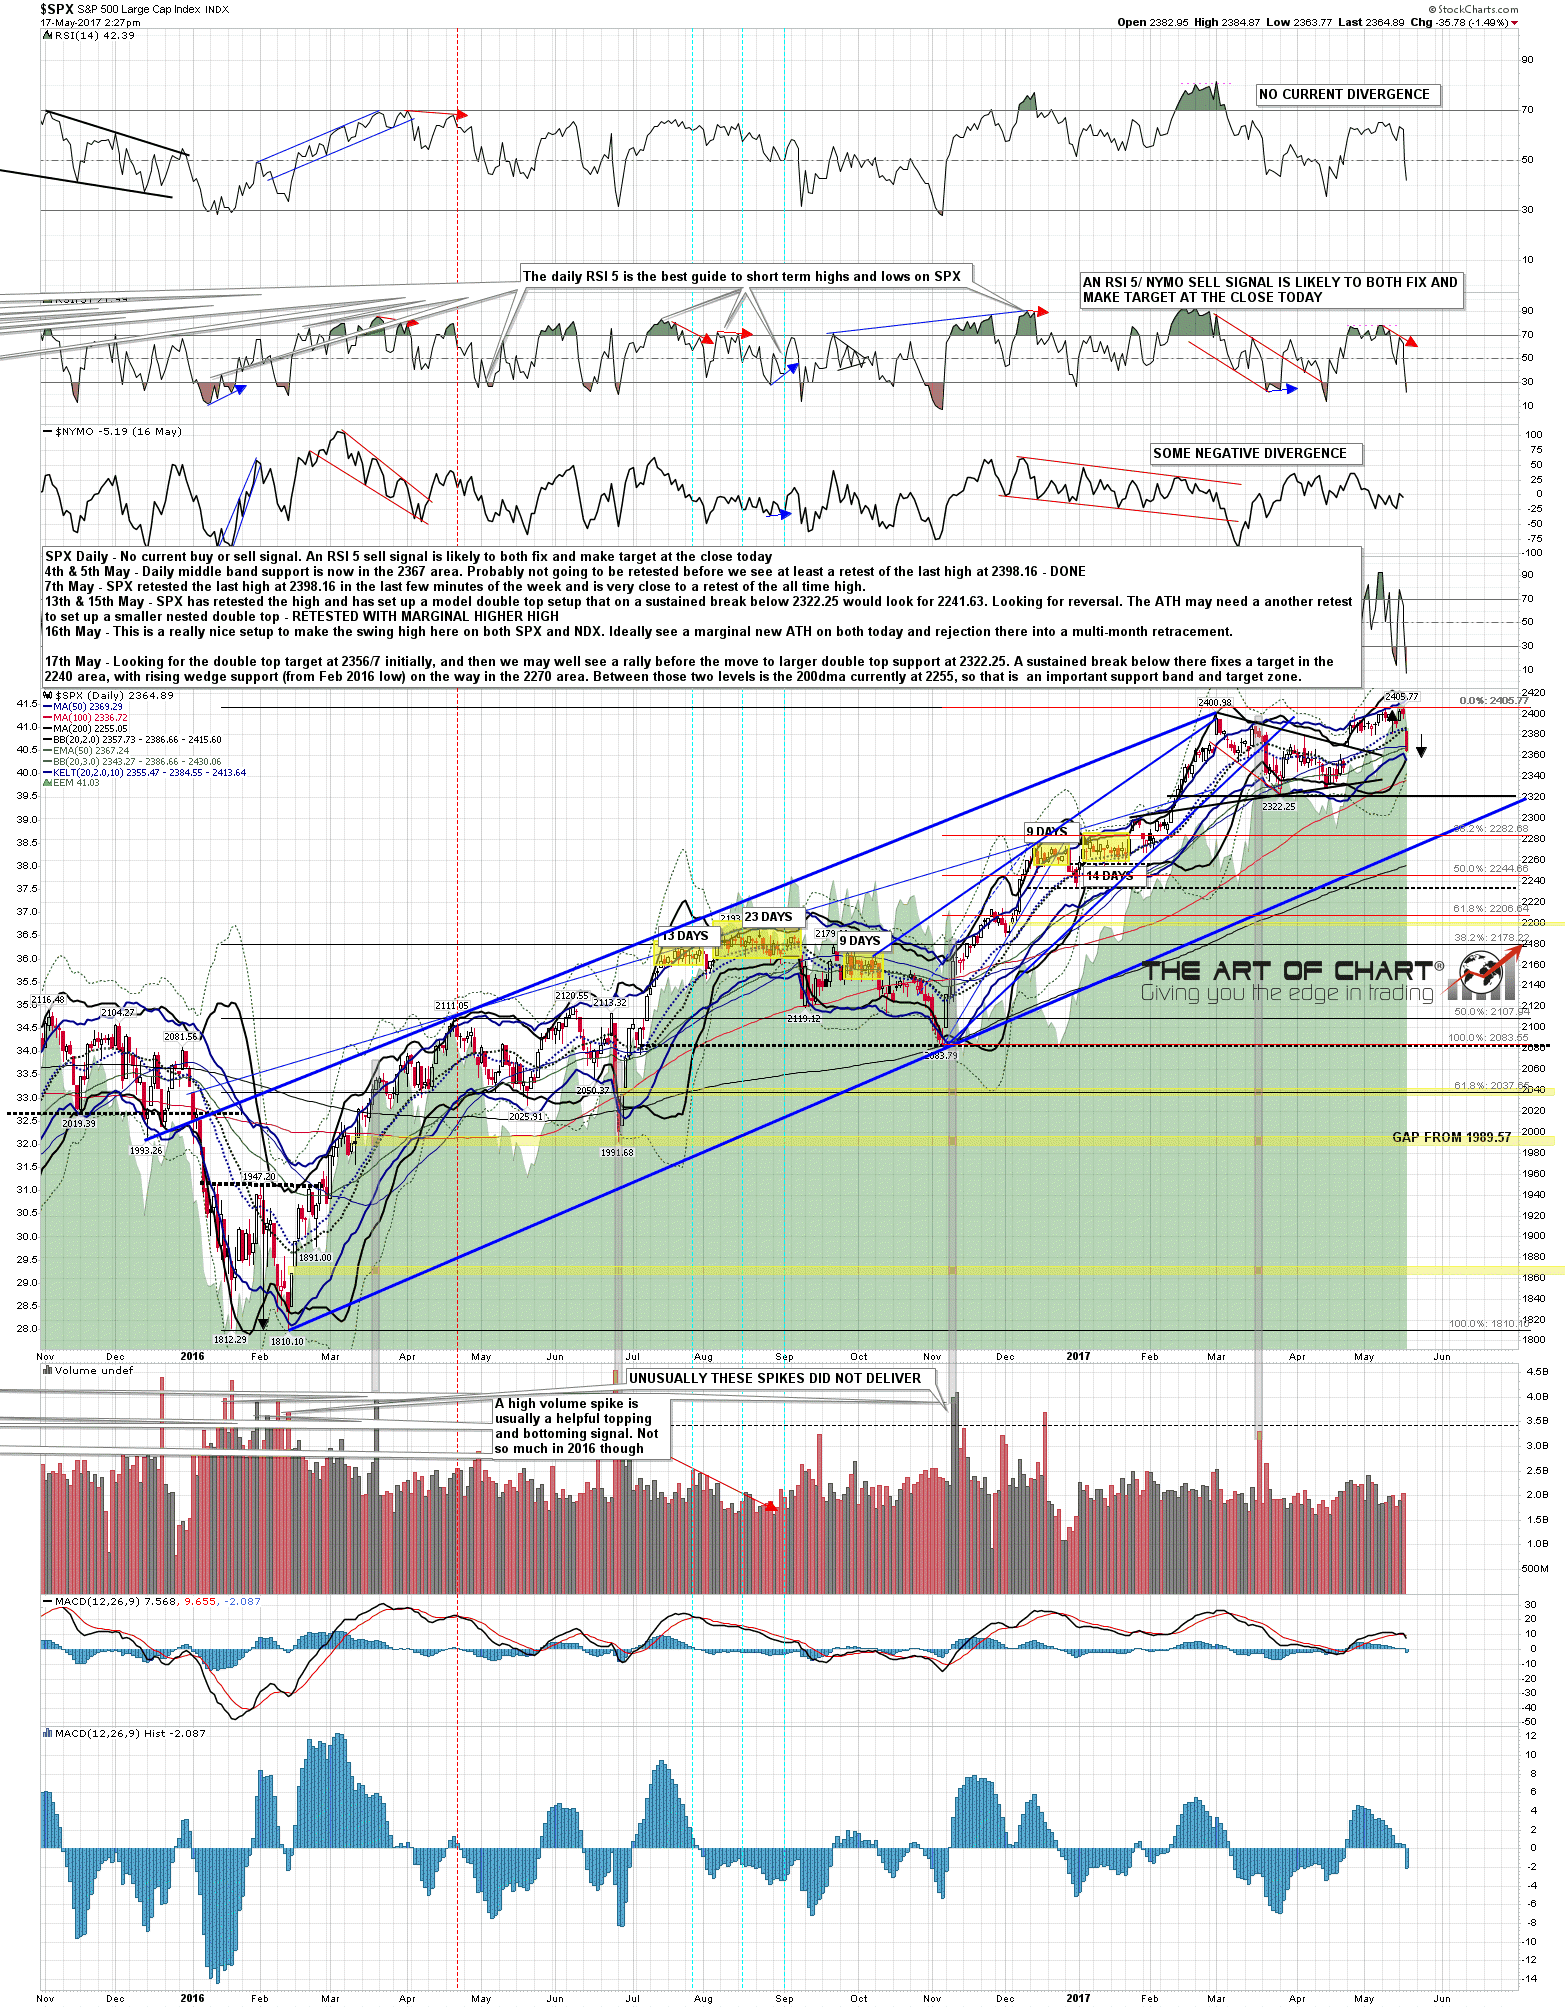
Further to yesterday’s post, the SPX has filled one prior gap up (in between the blue lines) and is currently filling a second (in between the red lines) (both made in the latter part of April), as shown on the following Daily chart.
At the moment, near-term support sits somewhere around 2320 (price support) to 2338 (external Fibonacci support shown in yesterday’s chart).
A drop and hold below 2320 could see a swift plunge to 2250, or lower and may be influenced by a major change in market perception of Washington’s ability (or inability) to function and produce any meaningful progress on the kinds of economic stimulus programs, tax cuts and reforms, etc., as promised by politicians during last year’s election and, on which, market players were counting, as they invested heavily from that time…particularly, as the Fed reduces its monetary stimulus measures and continues raising interest rates. (more…)