A week ago I commented on my SPX hourly chart that the obvious target for this move was falling channel resistance and SPX finally hit that at the high yesterday. After the confused mess of the last five days of trading that at last gives a clear setup here.
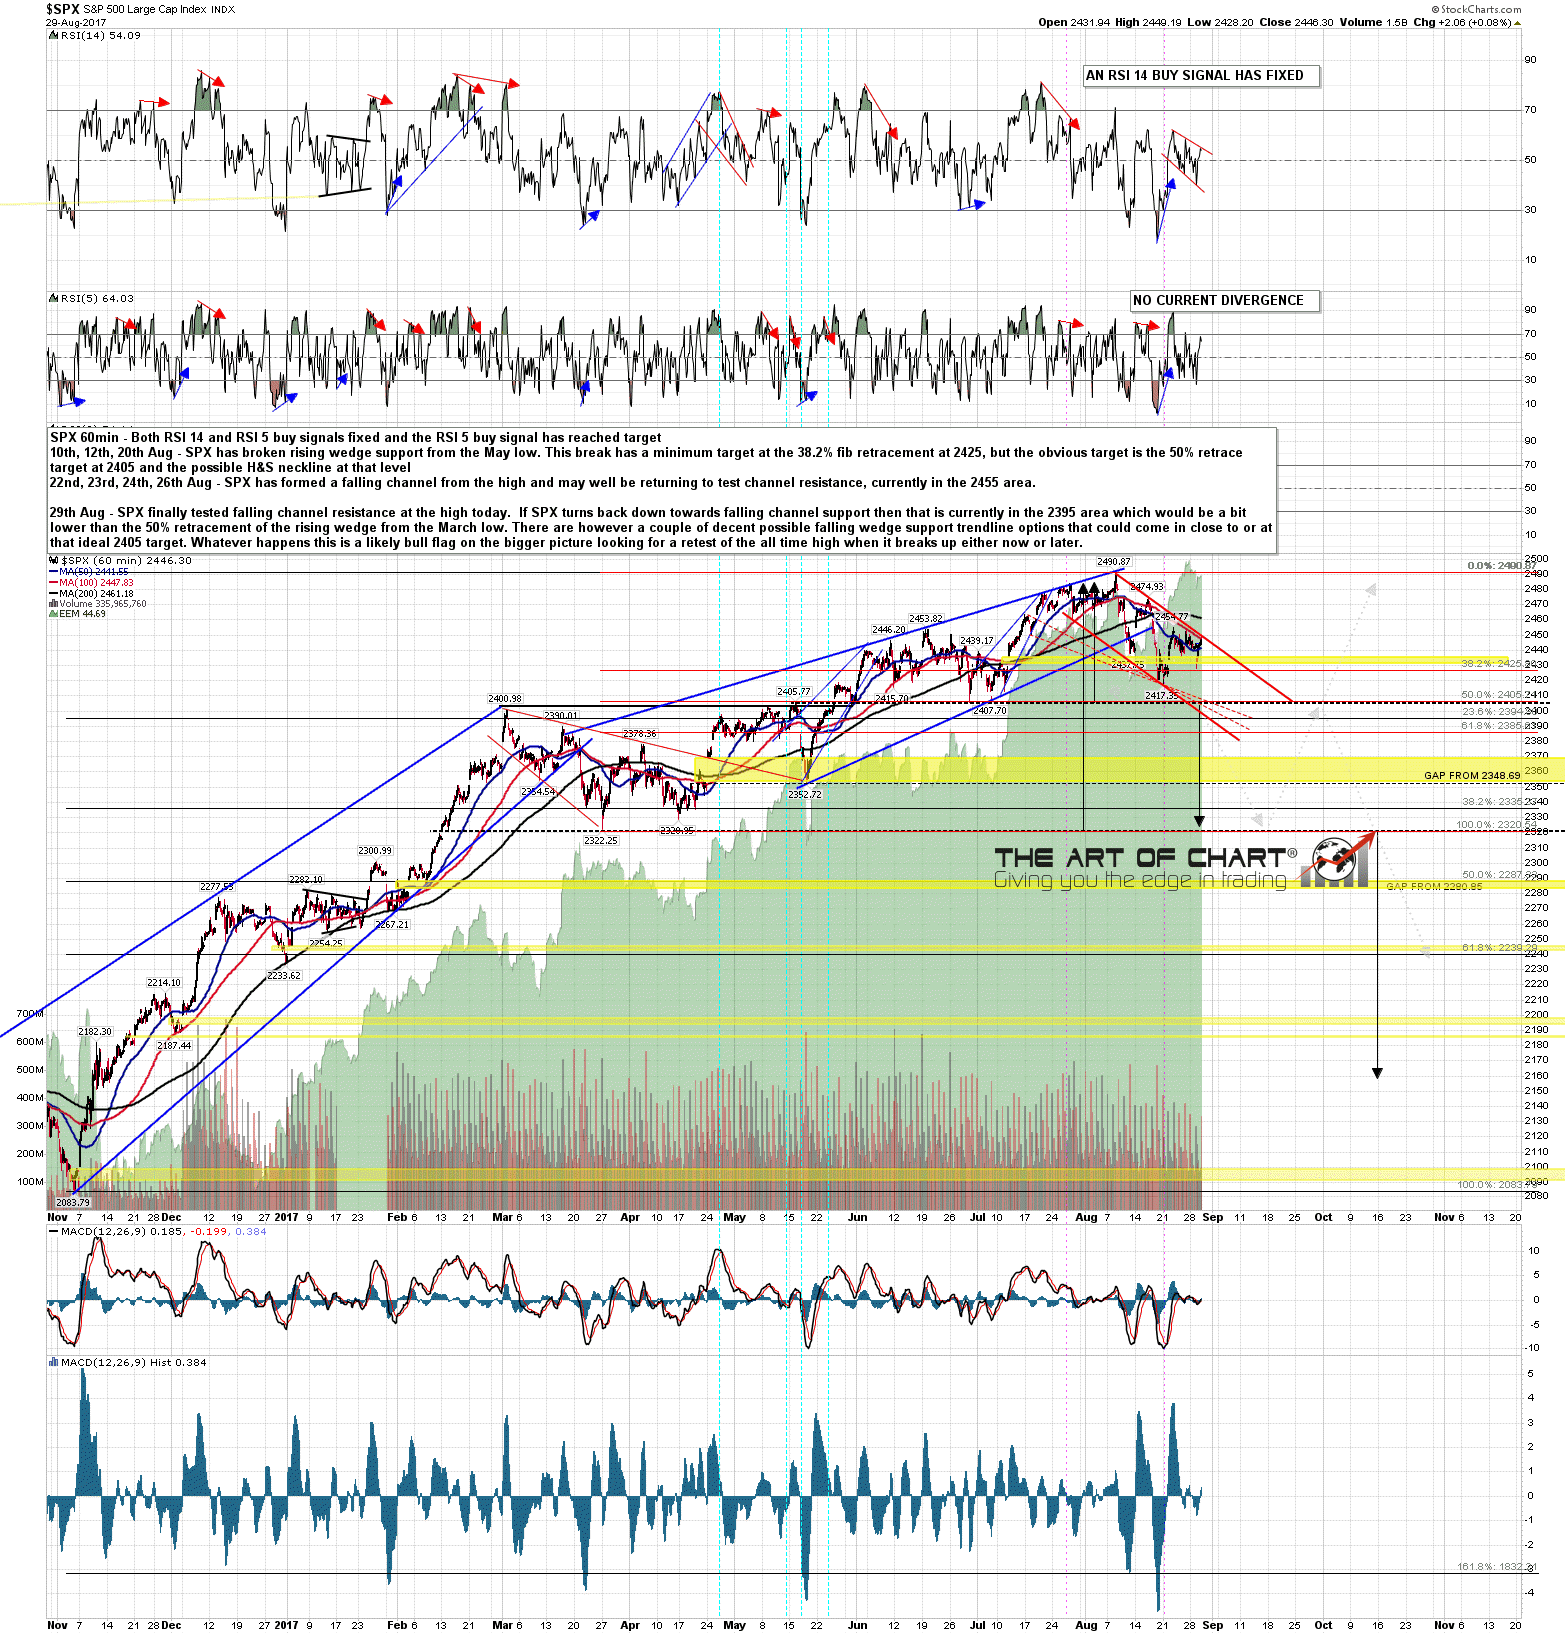
This falling channel is a likely bull flag which on a break up would have a minimum target at a retest of the all time high. The rising wedge from the March low has already retraced over 38.2% of the wedge so SPX could break up now into that retest. The open 60min buy signal likes that option and arguably so does the falling megaphone that has formed on the RSI 14 over the last few days. On the other hand a reversal here could well still reach the ideal 50% retracement target at 2405 that I gave at the end of July. Channel support is now in the 2395 area and a little low for that but there are a couple of alternate falling wedge support trendline options that could deliver a low close to that number.
When does this flag channel break? I’m leaning towards a lower low in my target area first but it could go either way and price will decide, likely today. A break up might well take the form of a gap up over flag channel resistance. We will see. SPX 60min chart:
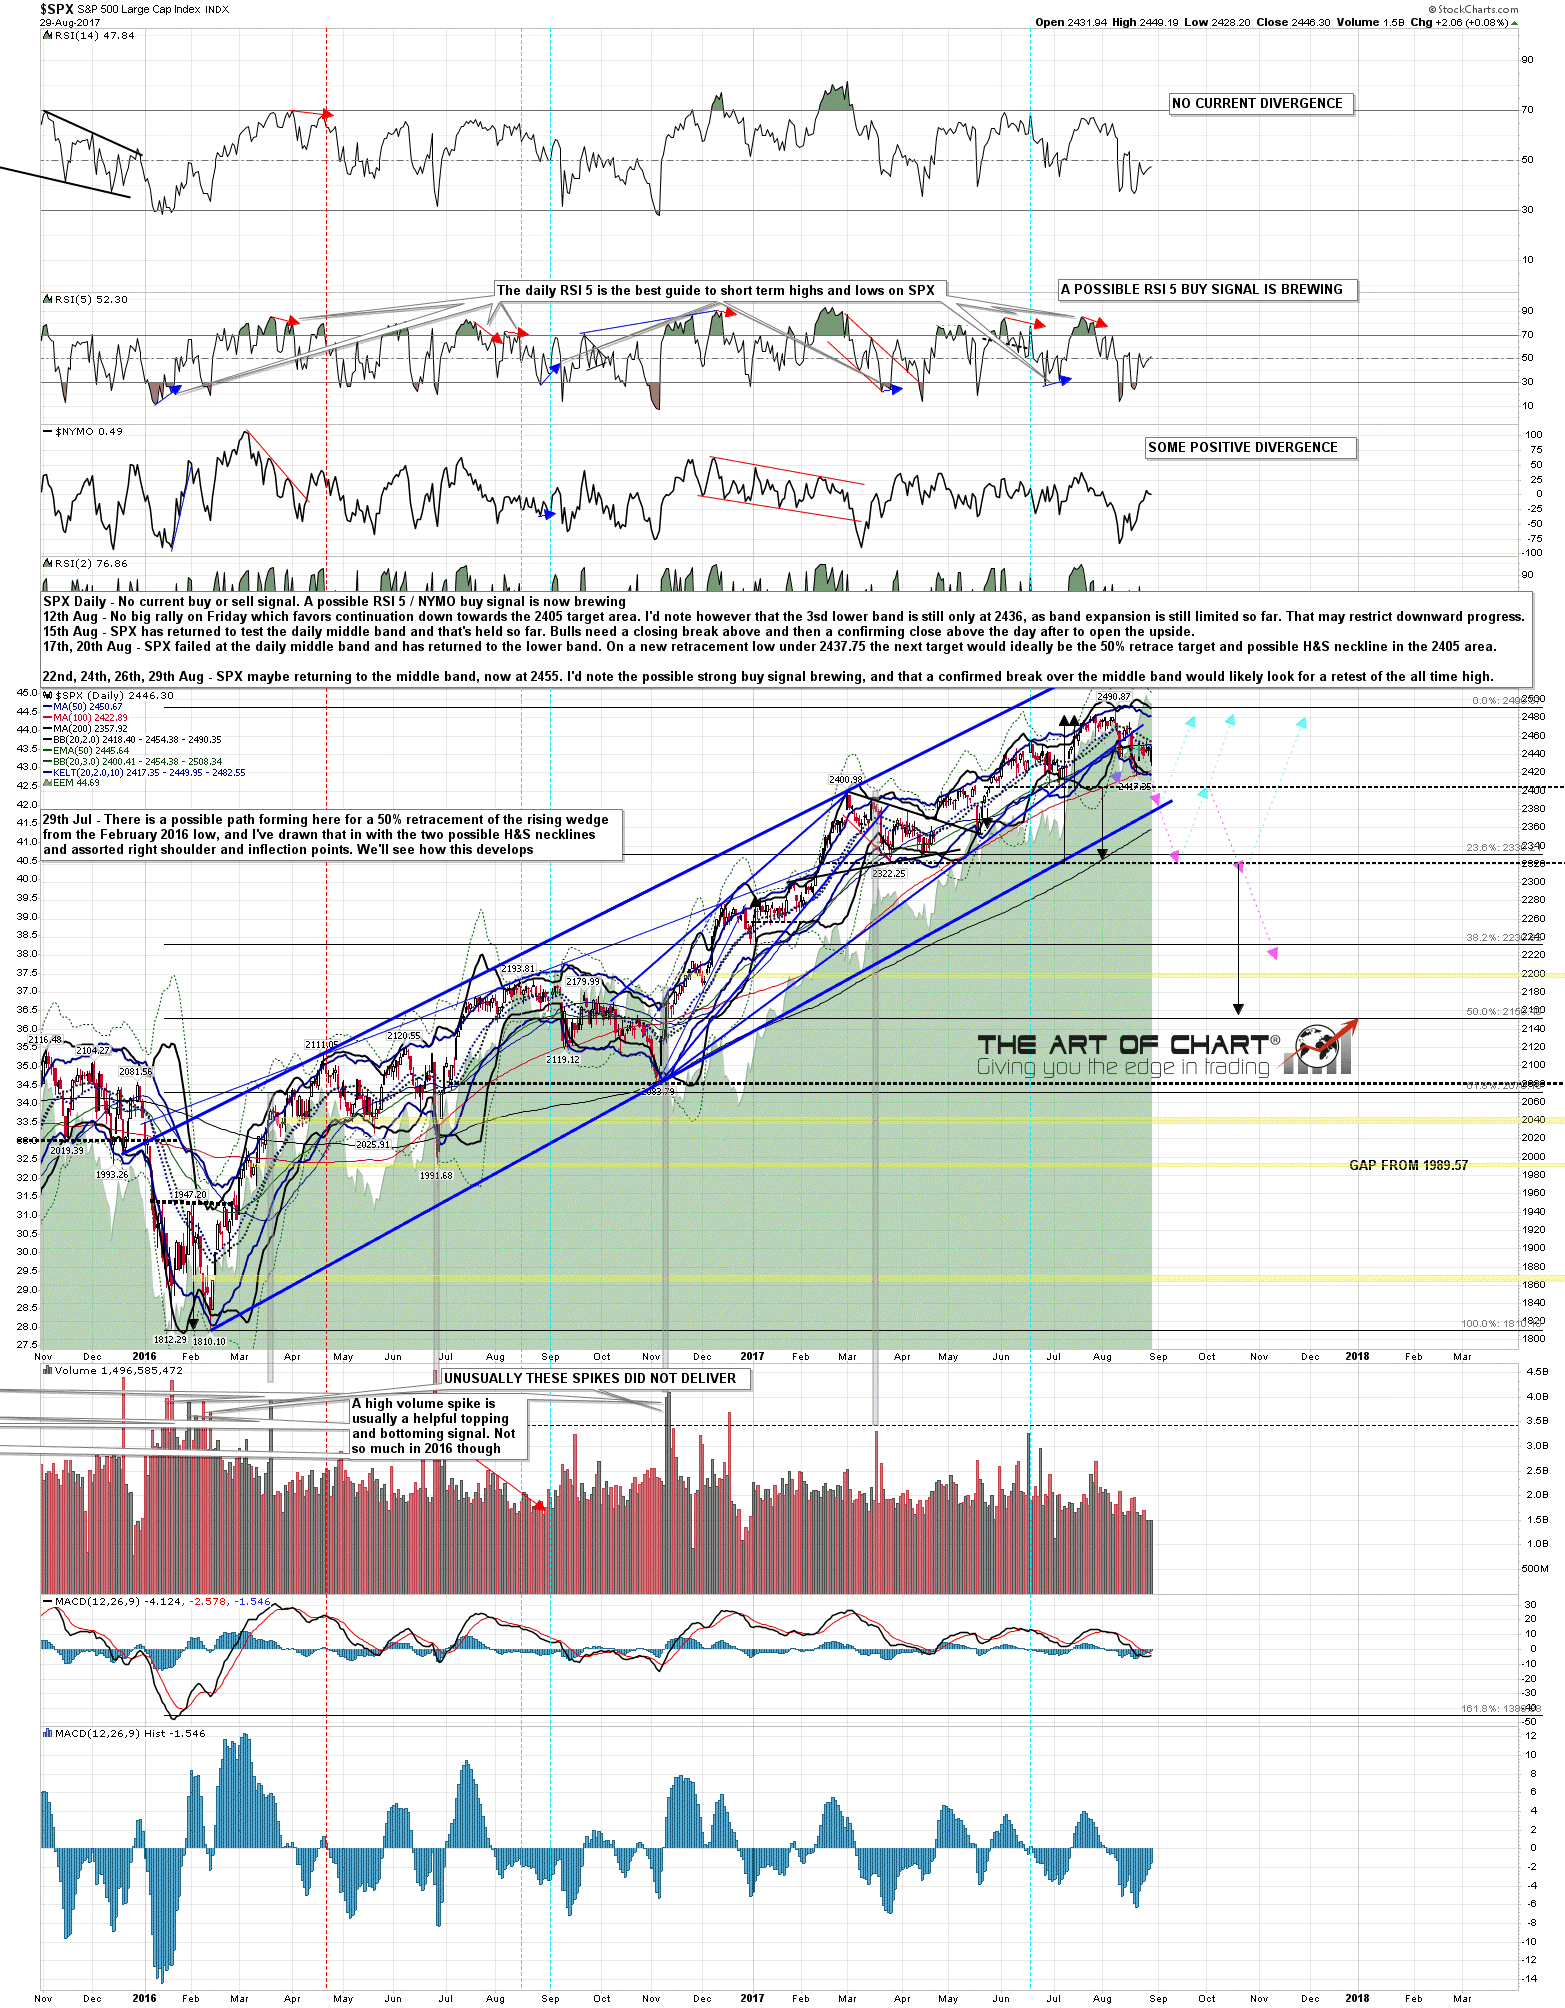
There is important resistance just above at the daily middle band of course and that closed yesterday in the 2454.4 area. Bulls also need to break and convert that to support on a daily closing basis. I would also note that main rising wedge support from the February 2016 low is now in the 2380 area, and if SPX is heading back to falling channel support, then that would also be a decent match with the 61.8% fib retracement of the rising wedge from the March low in the 2385 area. SPX daily chart: