
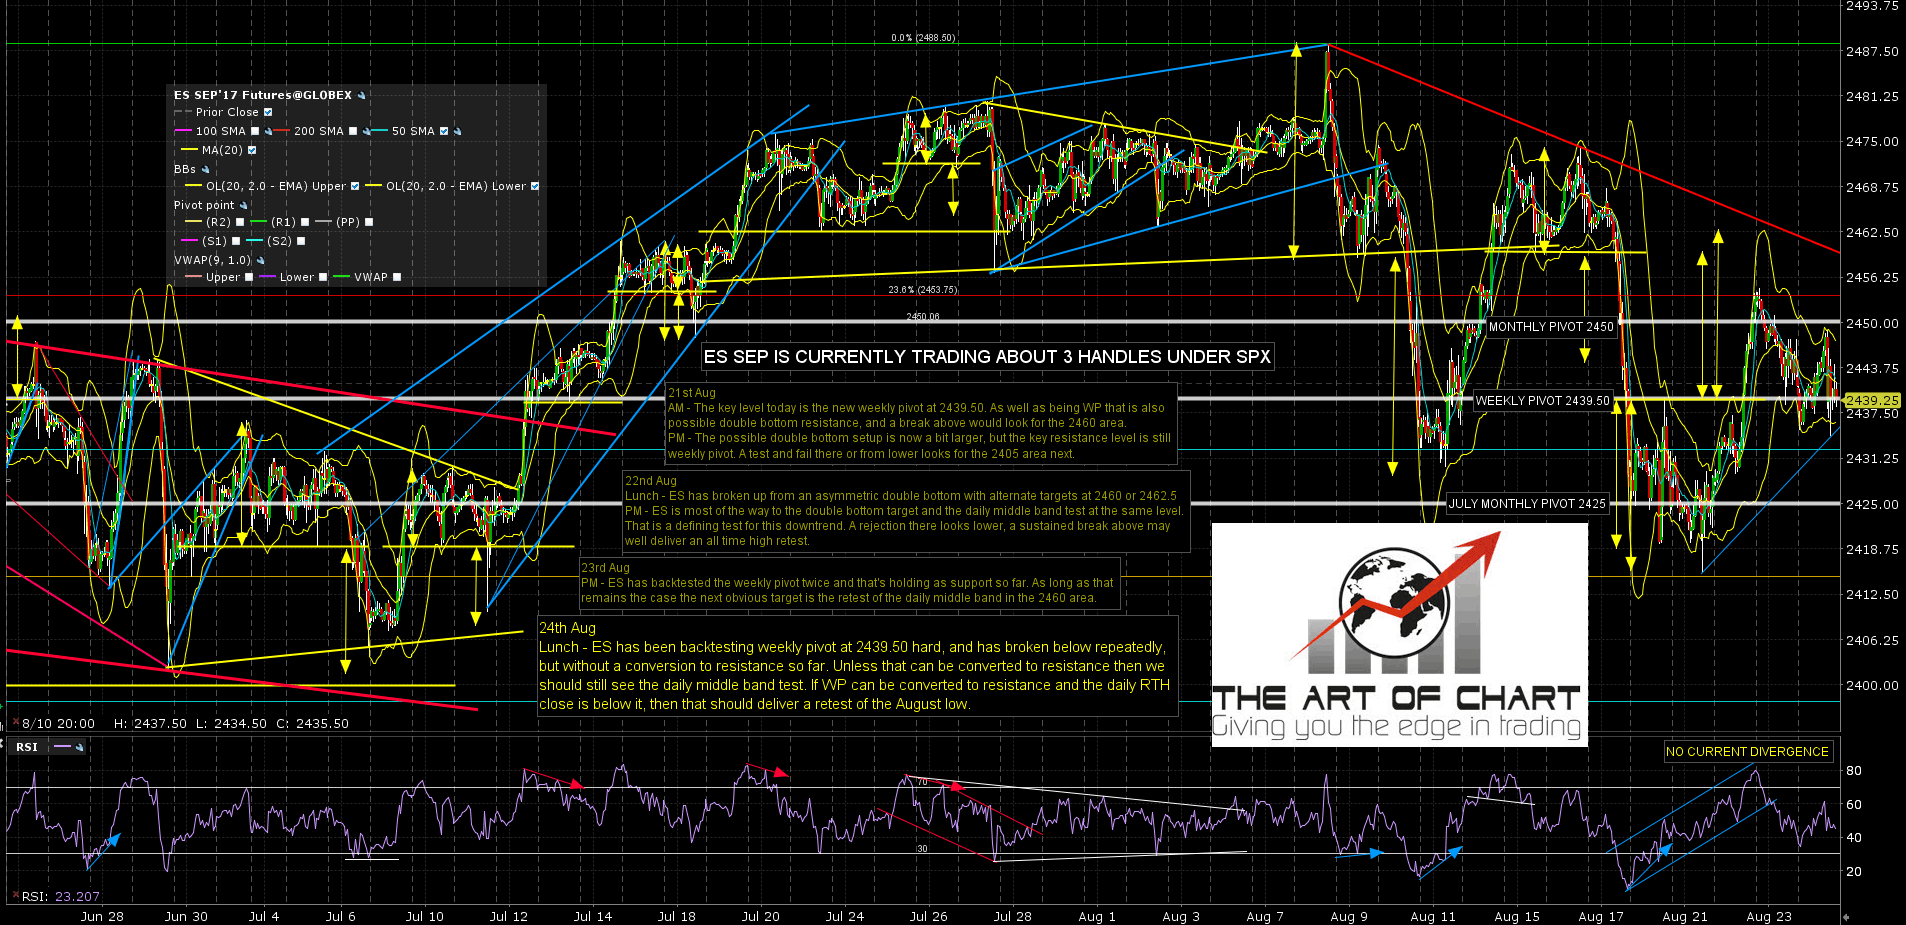
After Tuesday’s trend up day the obvious target for a retracement on ES was a backtest of the weekly pivot and we have been seeing that tested over the last two days, repeatedly. So far bears haven’t managed to convert that to resistance, but they haven’t stopped trying, and they may still succeed. ES Sep 60min chart:
This a particularly important test because the 5dma on SPX is now at 2438/9, and today is day three on the Three Day Rule. If bears can manage a daily close below that today then there would be a very high probability historically that the current retracement low would be retested in the near future. I have dozens of examples of this since the start of 2007 and the only two that didn’t manage the full retest were very marginal higher lows while triangles were forming. SPX daily 5dma chart:

So what if bears can’t convert weekly pivot to resistance? Well in that case I still have a falling channel on SPX (and on NDX, not shown today), and a fixed hourly RSI 14 buy signal to take SPX to the test of that channel resistance and the daily middle band, both now in the 2458 area. If the bears can break support and kill this setup then that would be an impressive show of strength for them. If they can’t then this compression at support may deliver a break back over the daily middle band, and open a possible retest of the all time high. SPX 60min chart:

If we do see a break back over the daily middle band then that would need a confirming close above again tomorrow, but with the falling channel broken the odds at that stage would be heavily weighted towards the bulls to deliver that. SPX daily chart:

This is an interesting support test. If bears do manage to break and convert support to resistance then that would be a demonstration of strength more impressive than anything seen so far in 2017. If we see that then the odds favor a test of 2400 soon. If they fail then SPX may well be testing 2500 next instead.
