
It has been a narrow range week on SPX, and for me the obvious read is that a triangle is forming on SPX/ES, with another possible triangle forming on NDX/NQ, and RUT/TF ploughing an independent furrow. I show the possible triangles on the ES and NQ charts below, though I’d note that Stan is not regarding these as high quality triangles.
RUT made the double top target at 1410 while SPX and NDX have been trading sideways. I’d note though the clear falling channels now established on both RUT and TF, and that buy signals are brewing on the hourly chart while the next obvious target within the falling channel is channel resistance, currently in the 1420/1 area. RUT 60min chart:

I was wondering about a possible all time high retest coming on SPX in my last post, and I’m still wondering about that. If we see a decent rally on TF here back into channel resistance then we might see that at the same time. SPX 60min chart:

The ES, NQ and TF futures charts below were done an hour before the RTH open for Daily Video Service subscribers at theartofchart.net. If you are interested in trying our services a 30 day free trial is available here.
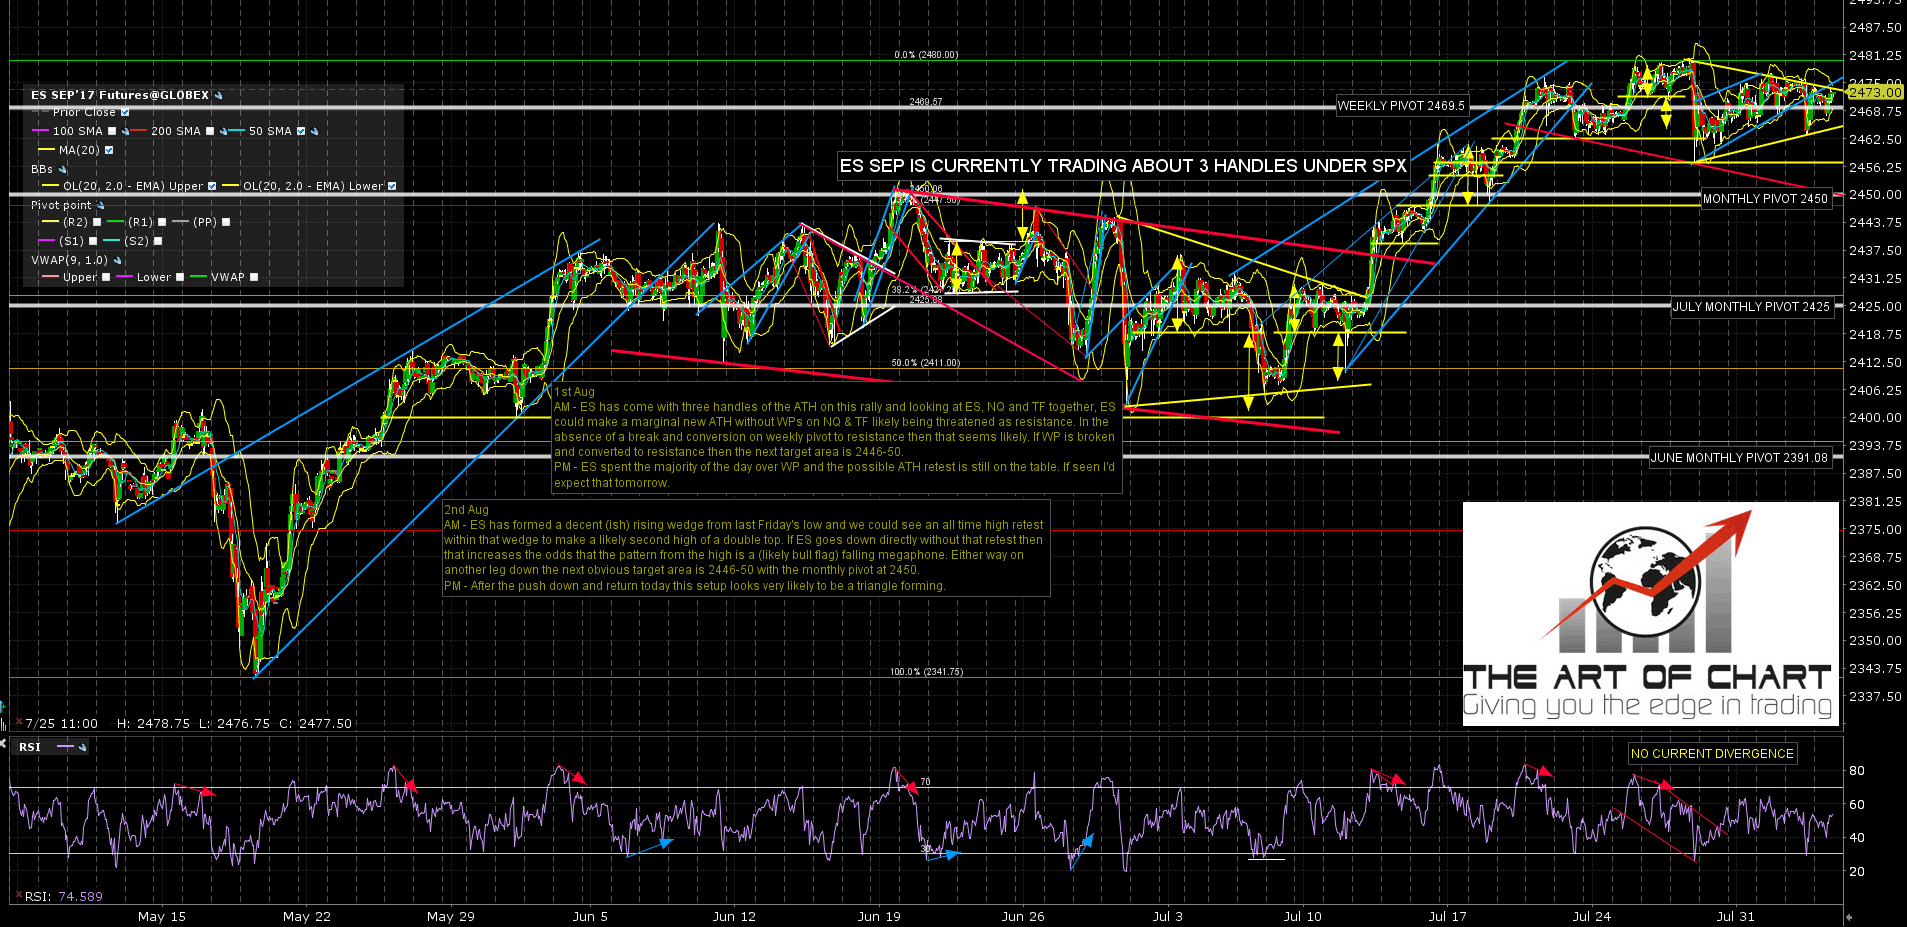
I drew the possible triangle on ES last night with the note that it was hard for me to interpret the action yesterday in any other way than as part of a triangle. If this is a triangle then triangle resistance is currently in the 2473 area, and the 70% lean would be for a break up into a minimum target at a retest of the high. ES Sep 60min chart:
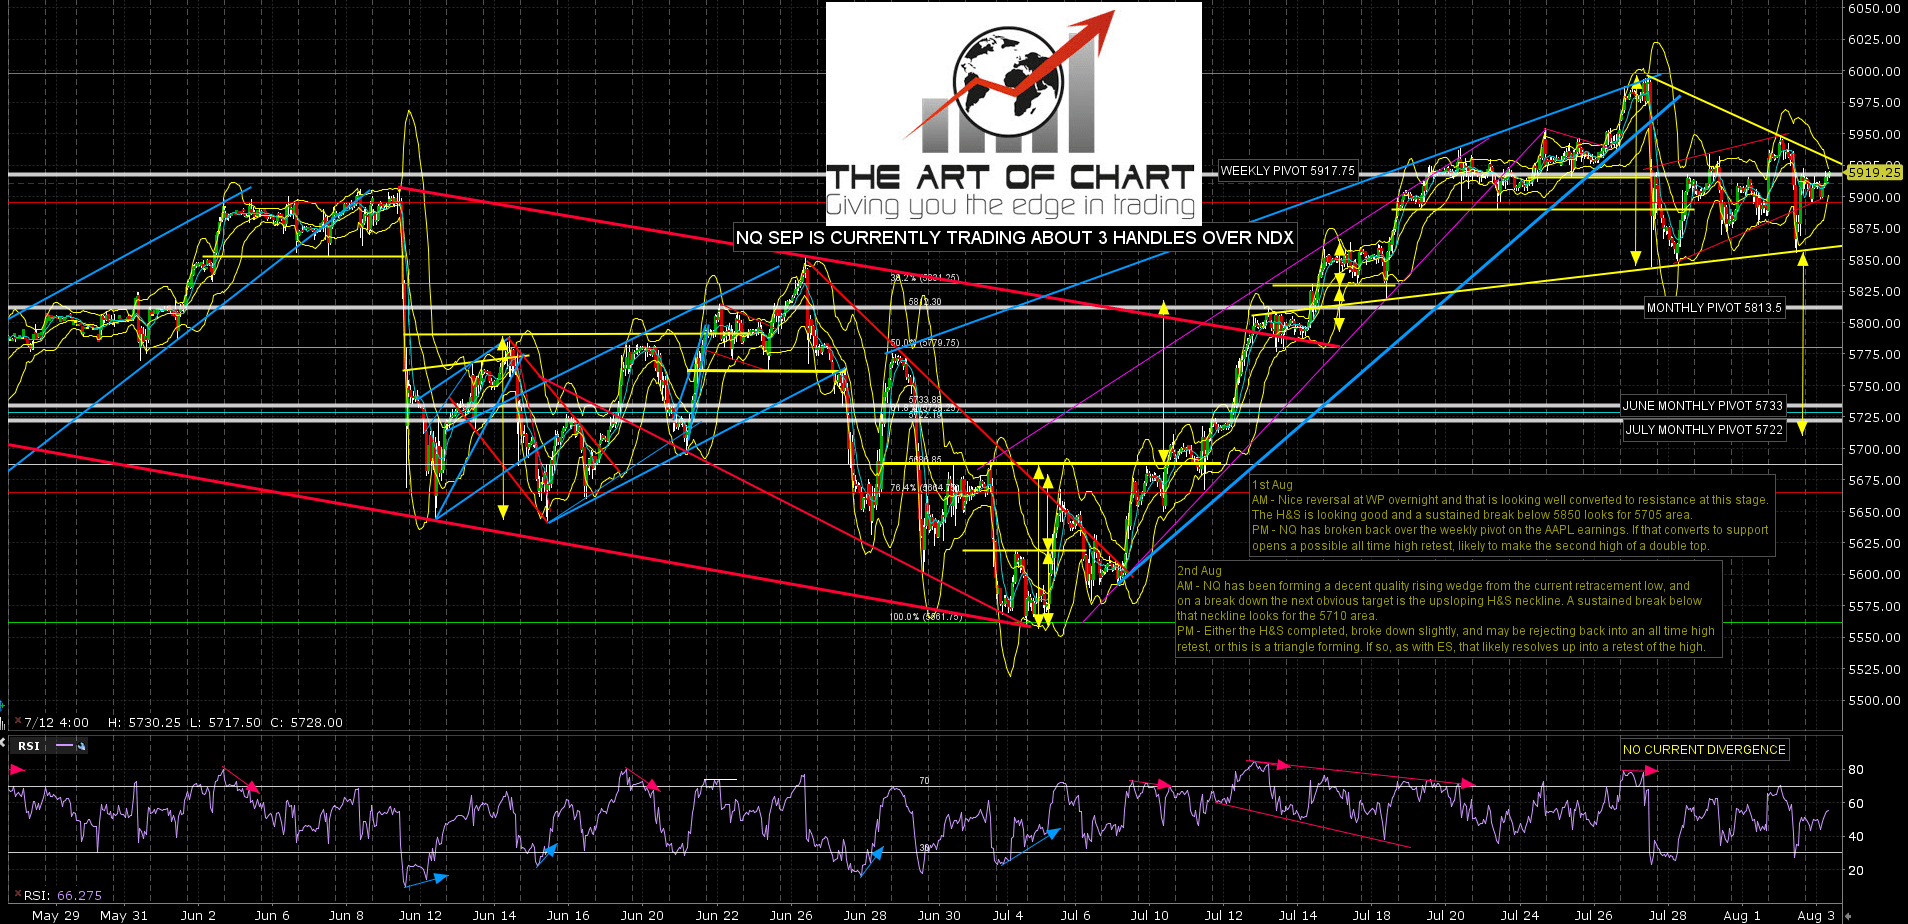
The triangle on NQ isn’t as high quality, and the all time high is considerably further away, but we may be looking at a matching triangle here. NQ Sep 60min chart:
The falling channel on RUT is given added weight with the matching channel on TF. As the trading hours are significantly different this is a rarer event than most would think. TF Sep 60min chart:

SPX/ES and NDX/NQ have been compressing all week as RUT/TF has been making the first downside targets. The obvious next move from my perspective is a modest rally back into falling channel resistance on RUT/TF with an ATH retest on SPX/ES, and possibly on NDX/NQ as well. We’ll see how that goes. If seen I’d expects the all time high retests to be part of topping patterns. There is still an open strong RSI5 / NYMO sell signal on the SPX daily chart.
