Note from Tim: below is Slim’s weekly video. He tells me he’s going on vacation, so it’ll be a couple of weeks before we see another. I’m working on six posts for this long weekend, so you’ll see those starting Saturday morning.
Slope of Hope Blog Posts
Slope initially began as a blog, so this is where most of the website’s content resides. Here we have tens of thousands of posts dating back over a decade. These are listed in reverse chronological order. Click on any category icon below to see posts tagged with that particular subject, or click on a word in the category cloud on the right side of the screen for more specific choices.
Post-Harvey Bar

Swing Trade RACE INFO MET

Commodity Leaders and Laggards
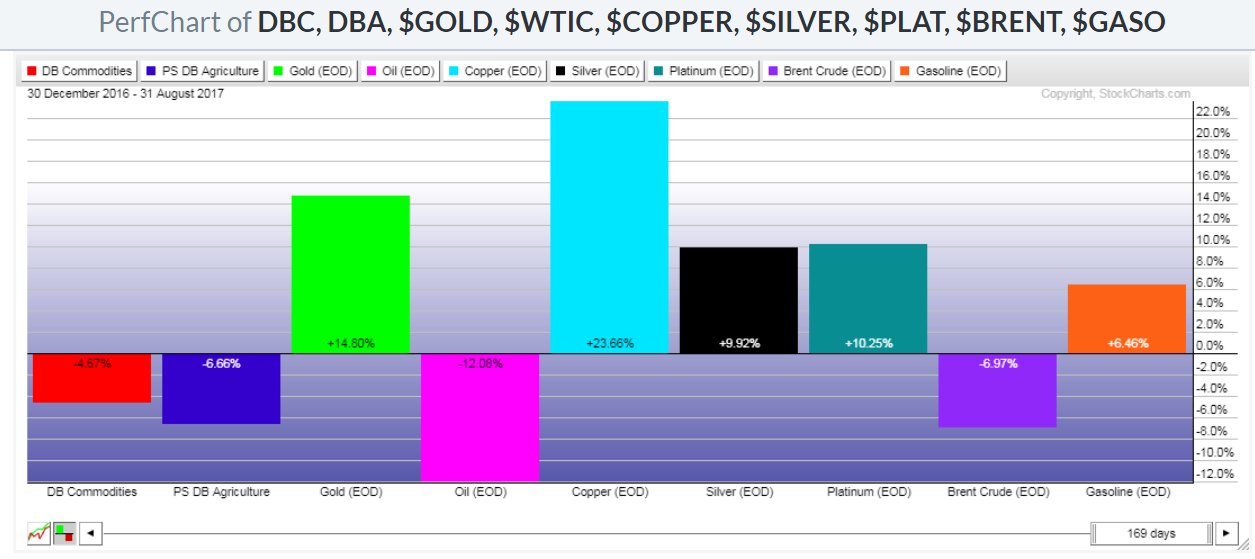
The following Year-to-Date and 2-Week graphs show which commodities (and commodity ETFs) have gained and lost the most (in terms of percentage) during those two time periods.
The second graph illustrates the massive 18.92% gains made in Gasoline during these past two weeks…no doubt, in anticipation of, and with respect to, current events surrounding the refinery shut-downs in Texas this week, due to the effects of Hurricane Harvey.
On a Year-to-Date basis, the laggards are WTIC Crude Oil, Brent Crude Oil, and the Agriculture ETF, while Copper leads in gains, followed by other metals.