
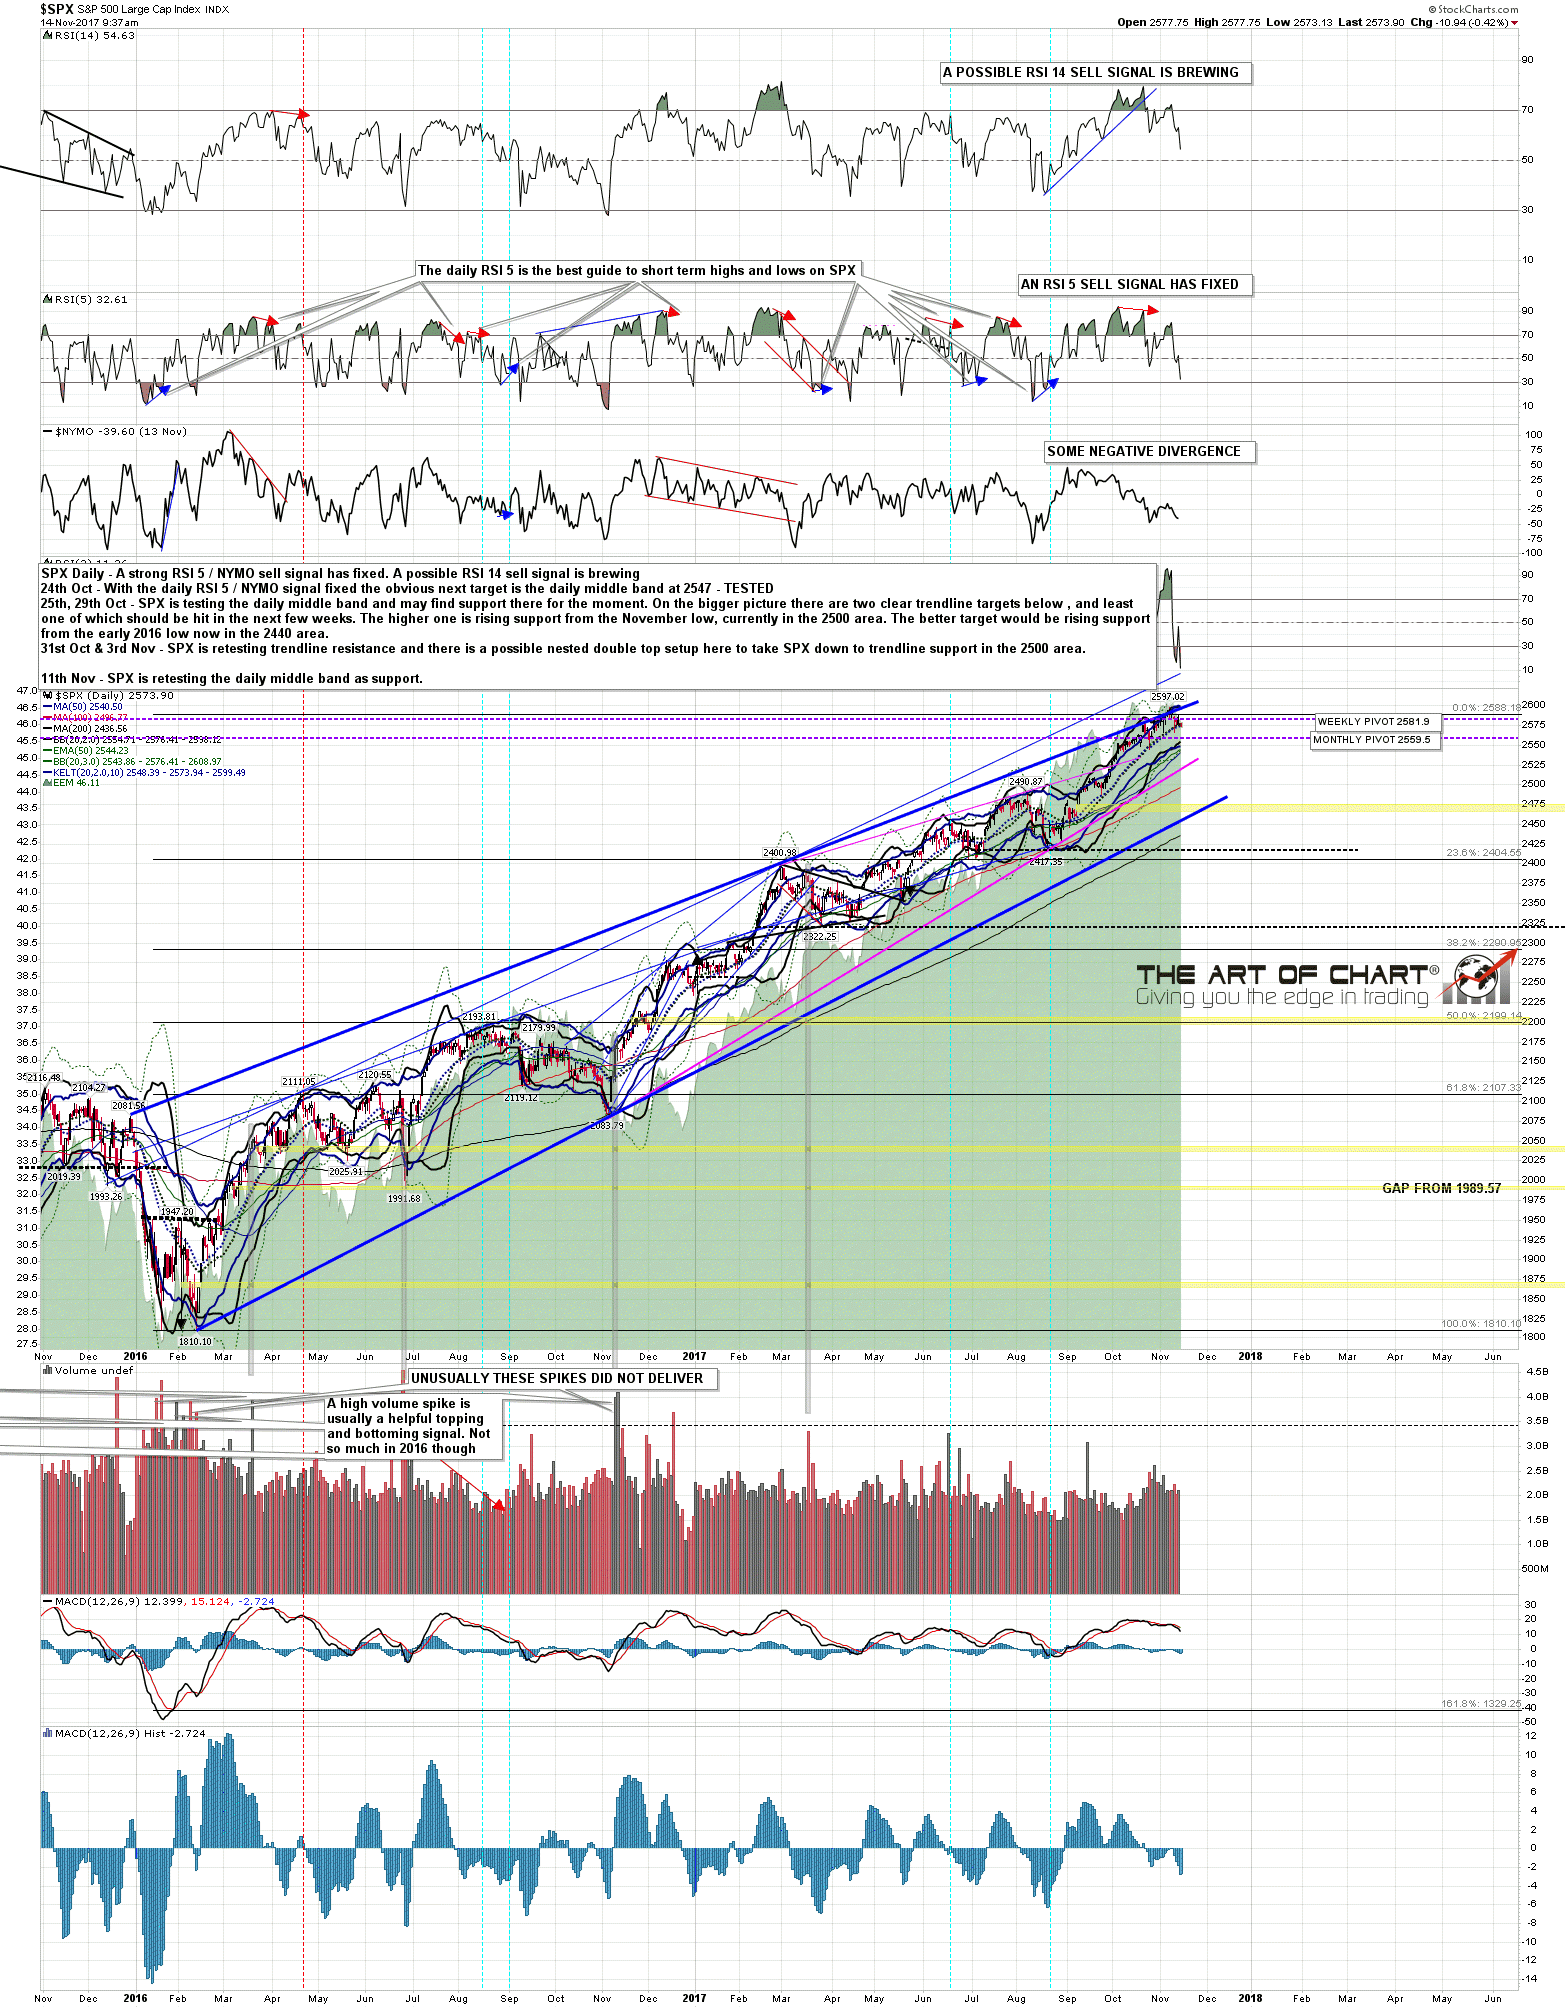
There are a lot of open sell signals on the SPX & ES charts here. On SPX there is still a strong RSI 5 / NYMO sell signal that could reach target today on a weak close. If we see that weak close the possible RSI 14 sell signal brewing here would likely fix. SPX daily chart:
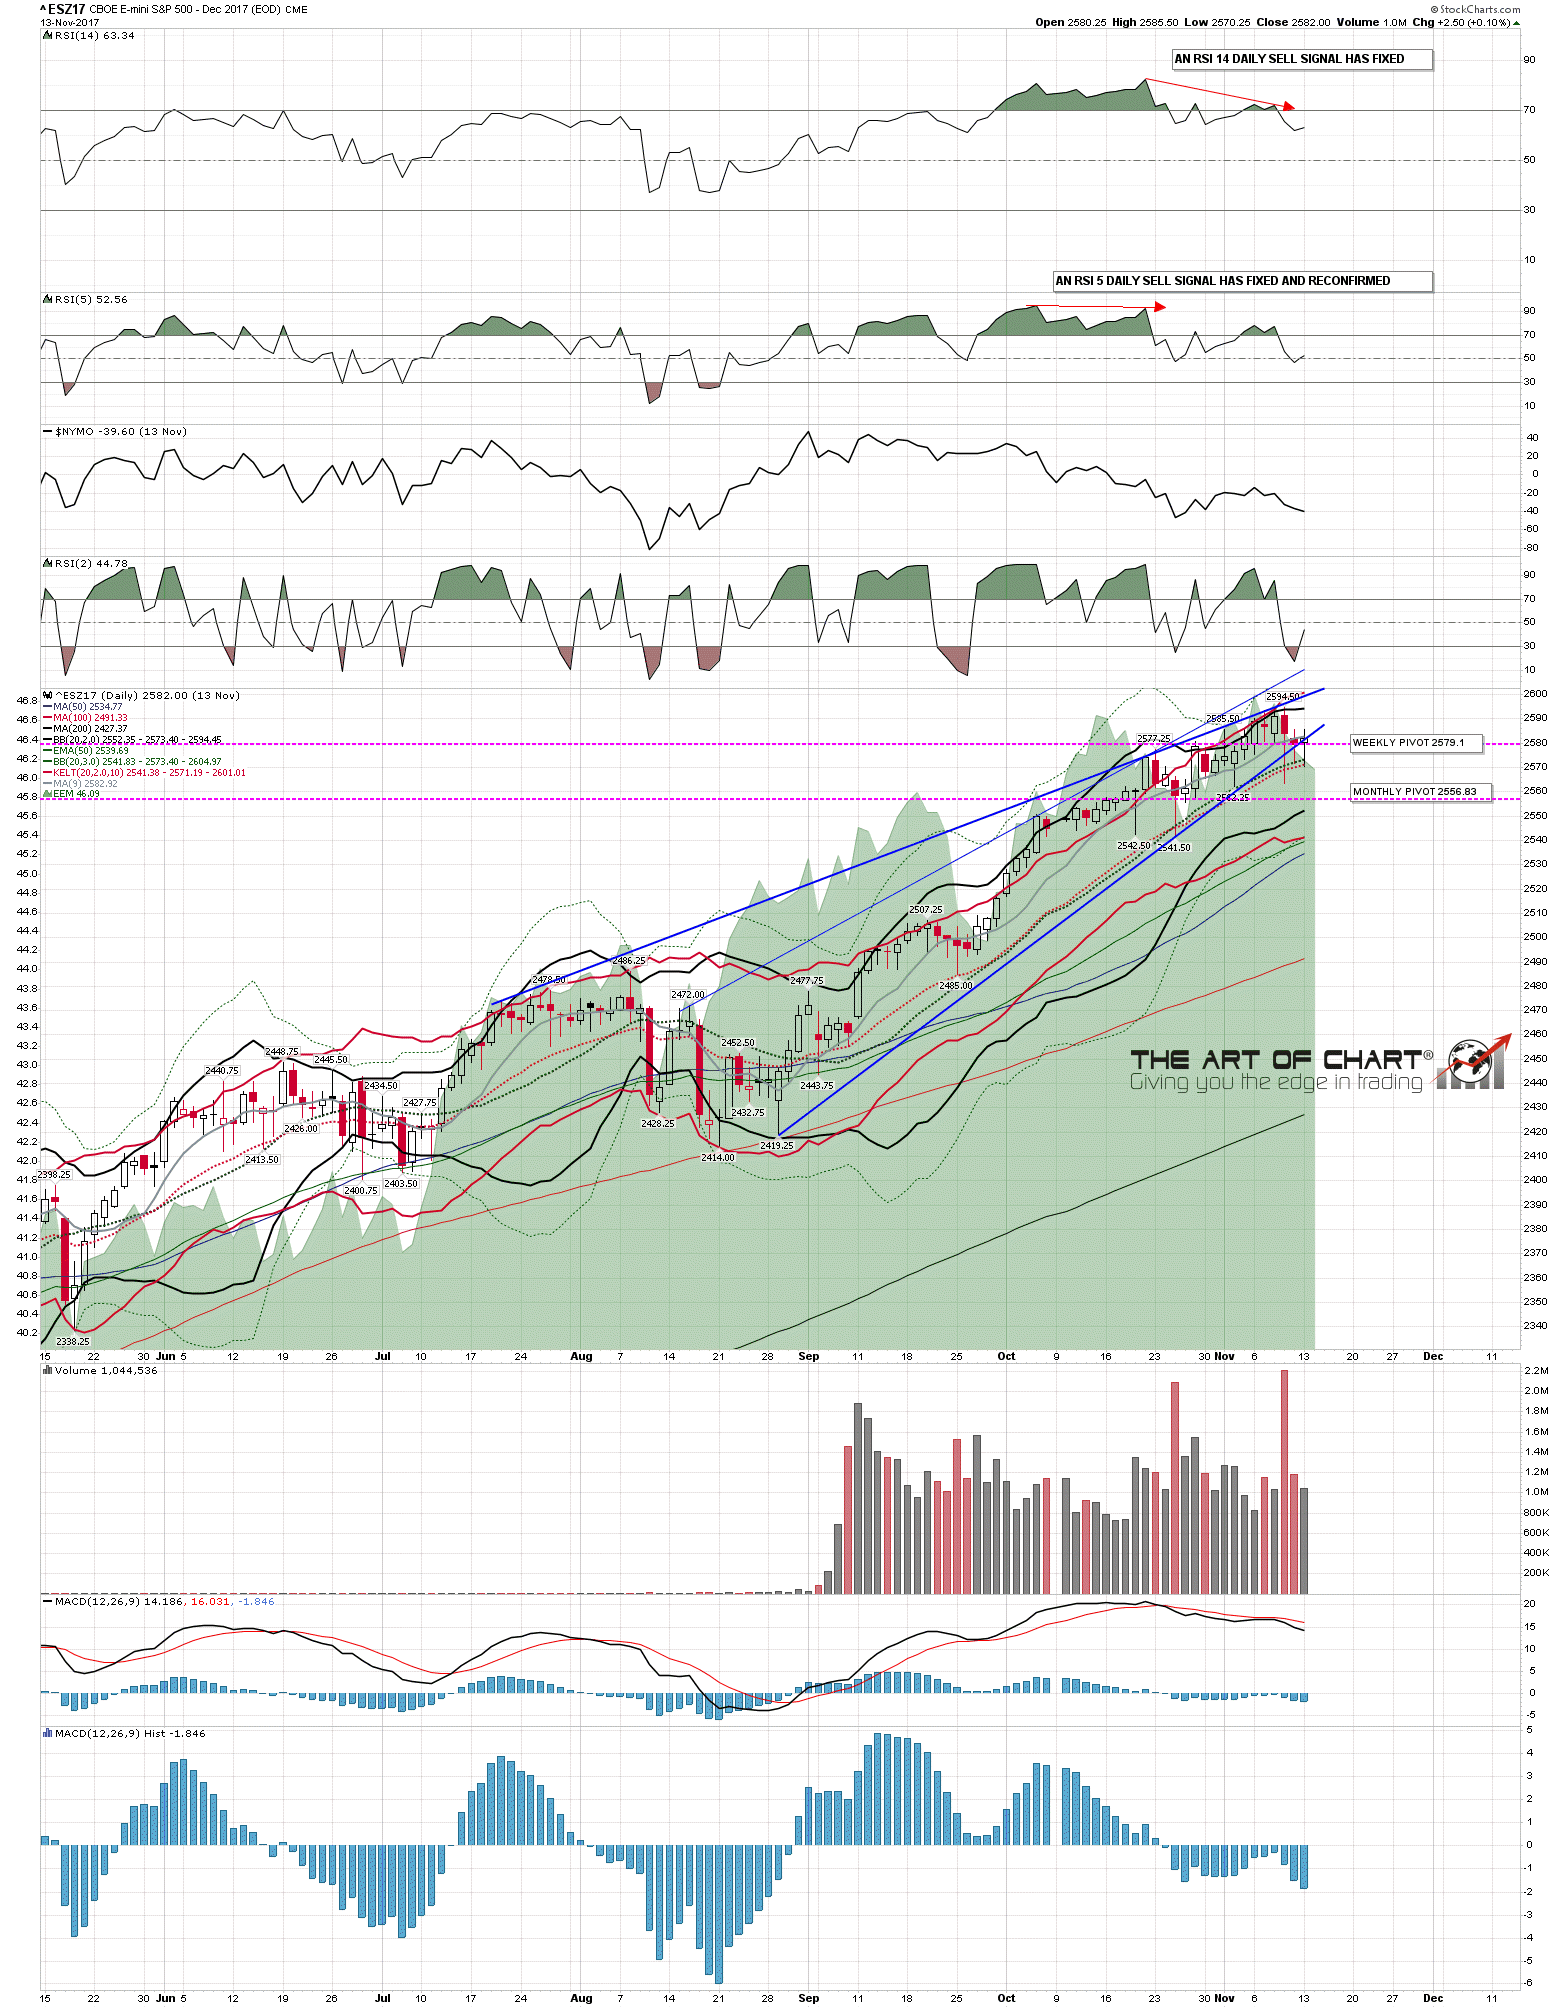
On the ES daily chart both RSI 14 and RSI 5 sell signals have fixed. This has happened twice in the last year and on the first occasion delivered a retracement from 2390 to 2312.75, and on the second occasion delivered a retracement from 2486.25 to 2419.25. The obvious rising support trendlines on SPX are now in the 2520 and 2460 areas and this setup looks promising into at least a test of the first of those support trendlines. ES daily chart:
The ES, NQ and TF futures charts below were done before the RTH open for Daily Video Service subscribers at theartofchart.net. If you are interested in trying our services a 30 day free trial is available here.
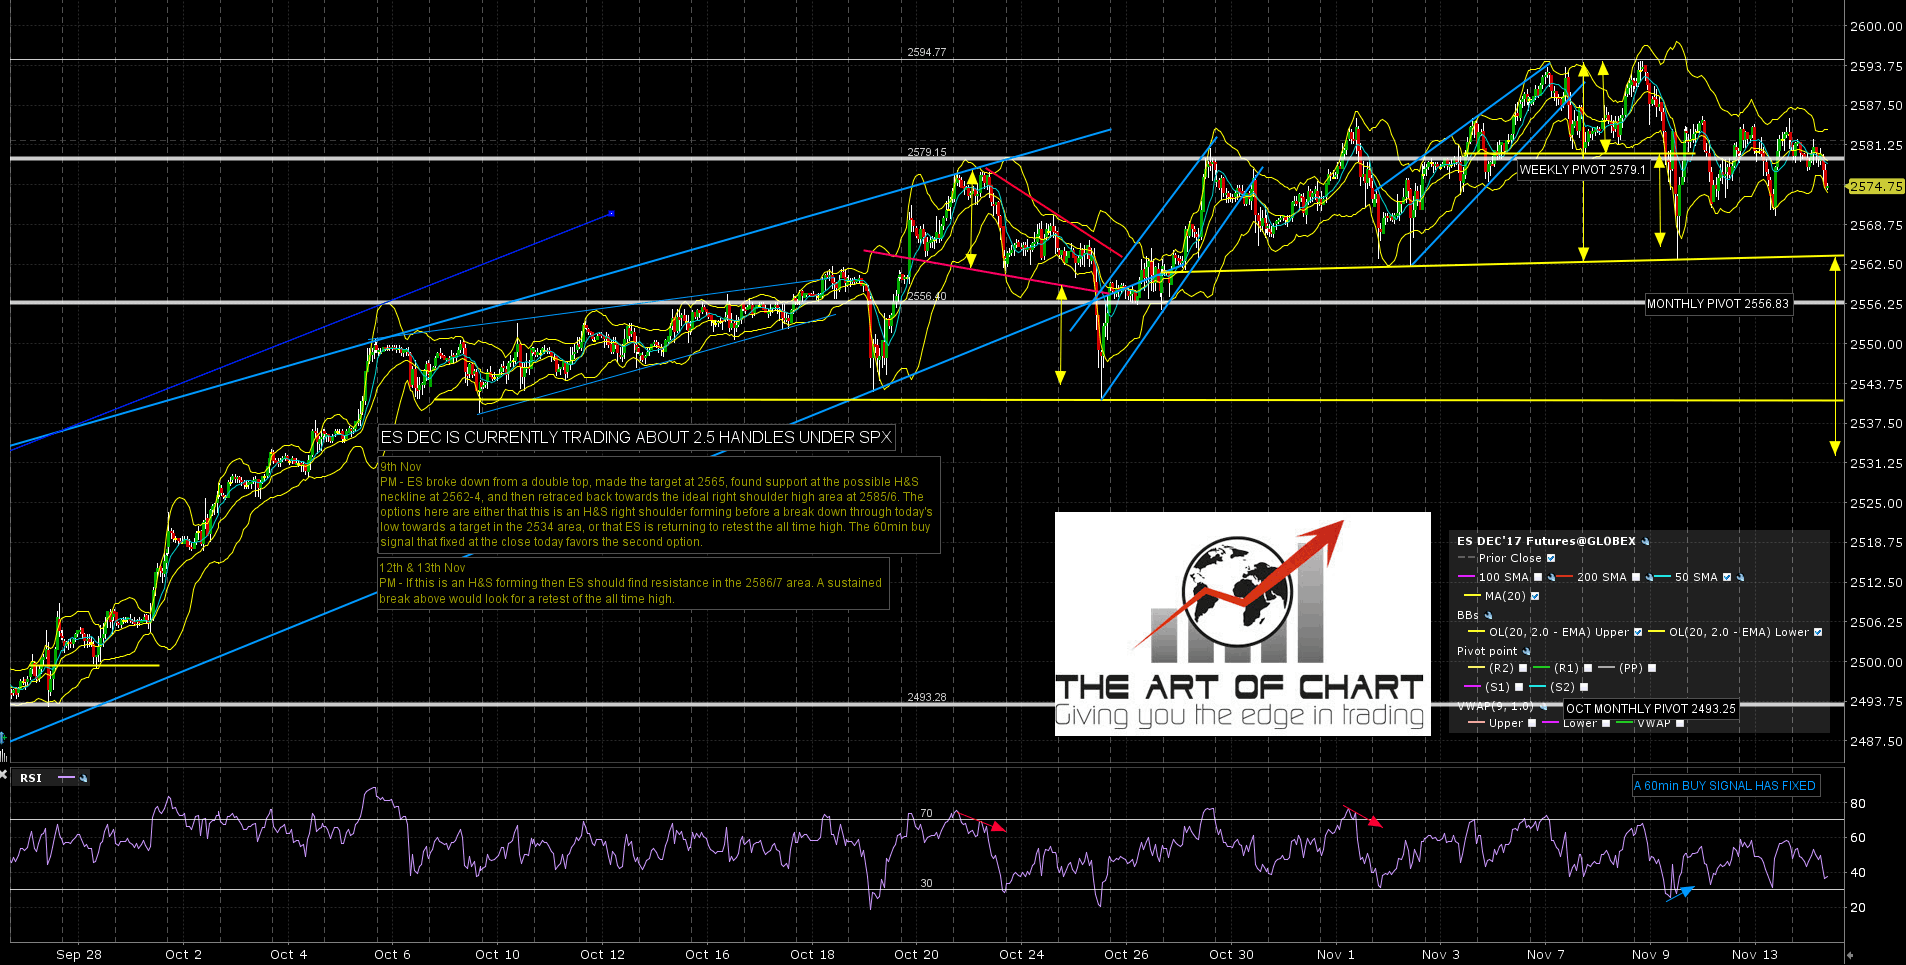
So is the short term high in? Well there’s a very decently formed possible H&S forming on the ES hourly chart and that may deliver, though there are open shorter term 60min buy signals on all of the ES, NQ and TF charts that may need some more upside before a likely larger retracement. Key resistance on ES is at 2586/7 and the weekly pivot is at 2579.1. ES Dec 60min chart:
There is no obvious topping pattern on NQ and if the weekly pivot at 2579.1 can be converted to support then a retest of the all time high could establish a double top to take NQ lower. NQ Dec 60min chart:

TF has been retracing for over five weeks now but has the most potentially bullish looking chart, because the obvious read on TF is that a smaller falling wedge is forming within a larger falling megaphone that would likely be a bull flag on the bigger picture before an eventual retest of the all time high. This setup invalidates on a break down below trendline support, currently in the 1456 area. A retest of the weekly pivot at 1479.6 would mean that falling wedge resistance had broken up. TF Dec 60min chart:

One way or the other we should see at least a modest retracement soon.
Stan and I are doing a free webinar at theartofchart.net after the close on Thursday looking at AAPL, AMZN, FB, NFLX & TSLA. If you’d like to attend that you can register for it on our November Free Webinars Page.
