
We did the monthly free public Chart Chat at theartofchart.net yesterday, and if you missed that the recording is posted on the November Free Webinars page here.
We were asked a question about a correlation there, and I remarked that I don’t think most correlations are worth much. If you think USD is going down and therefore gold should go up, then it’s best to cut out the middleman and just short USD. That’s not to say however that there aren’t some striking correlations around.
As part of her ongoing campaign to make me feel old and decrepit my daughter has found herself a job, and while she was going to that job on Saturday morning she was astonished to find a group of enthusiastic Flat Earthers sharing the … um …. flat news in the city centre. It appears that Chester is a major centre for these hardcore traditionalists, meaning that there appear to be at least five of them, and they have a website with reasonably grammatical sentences and so on here. It’s certainly an interesting read and they seem very passionate about their beliefs.
This brought two things to mind for me. The first is that, as I have mentioned before, the search for intelligent life on Earth is at an early stage, and doesn’t appear to be going that well. The second thing is that I’ve often noted before that there seems to be a strong inverse correlation between the passion devoted to a cherished belief, and the amount of rational thought that has gone into forming that belief. That at least is a correlation that seems fairly dependable.
This was their main leaflet that my daughter brought back from this interesting experience. It certainly evokes some thought-provoking insights about human psychology, if nothing else. Further details on this fascinating global conspiracy can be found here. I didn’t get a chance to listen to the flat earth music but I have no reason to doubt that it will be at least as impressive as the literature.

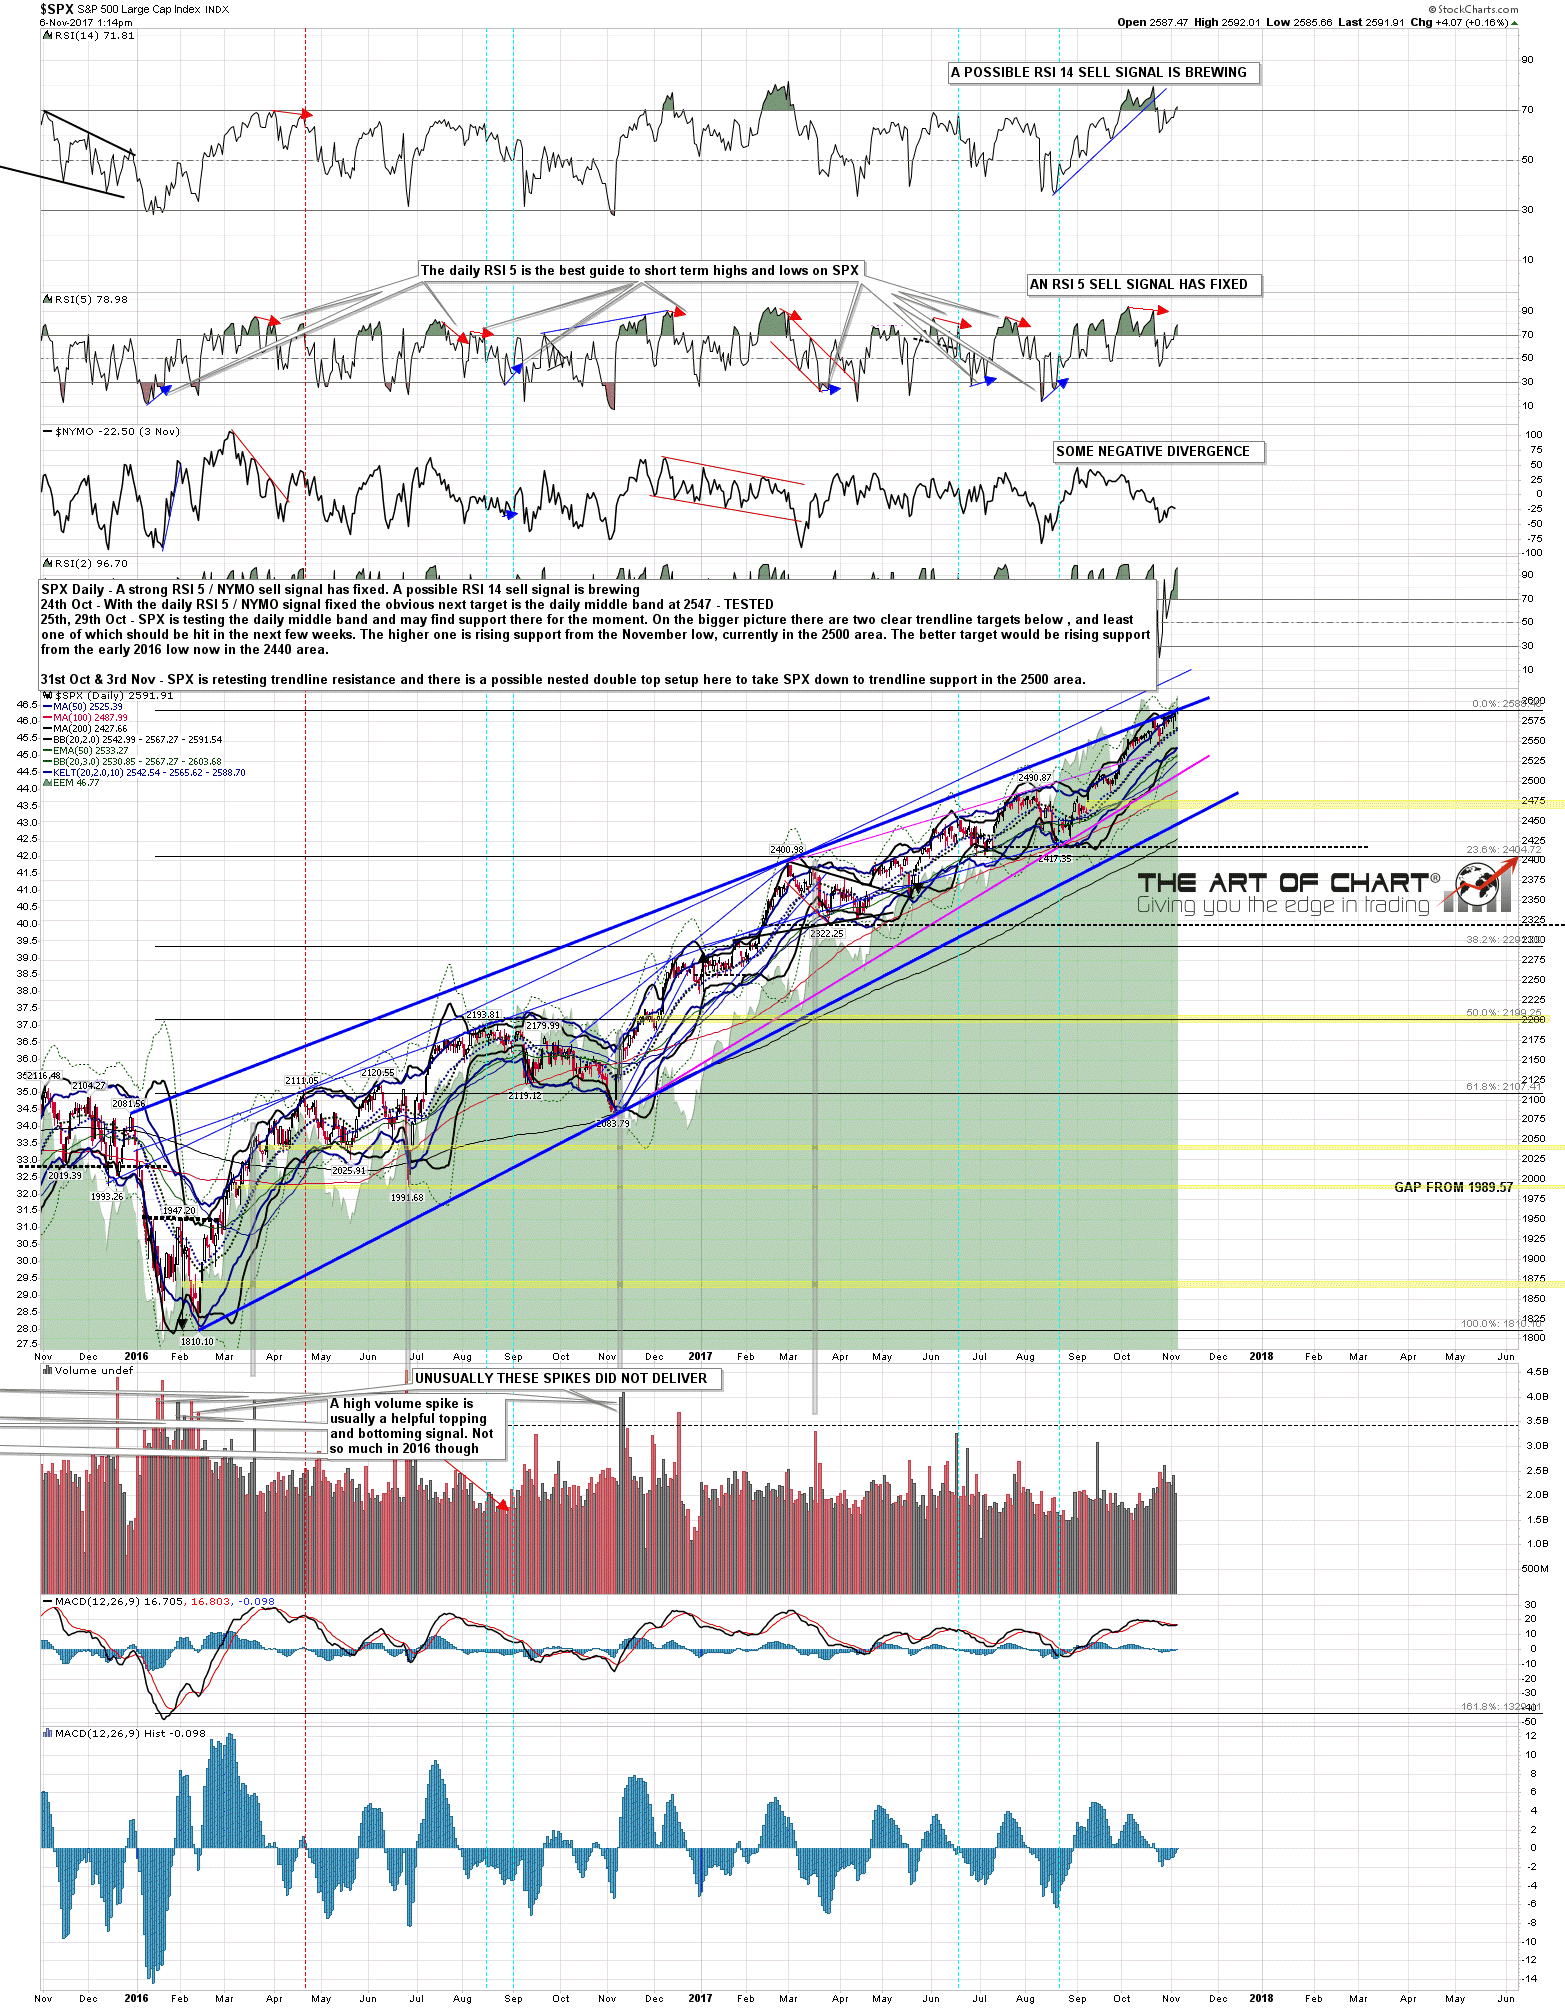
Moving back to the markets SPX is at decent trendline resistance, with a strong daily RSI 5 / NYMO sell signal fixed and a possible daily RSI 14 sell signal brewing. Is it going to turn? Possibly, though the bear side really needs to show us something before they can be taken seriously. A break below the weekly pivot and conversion to resistance would be a start. On SPX that is at 2580.80. SPX daily chart:
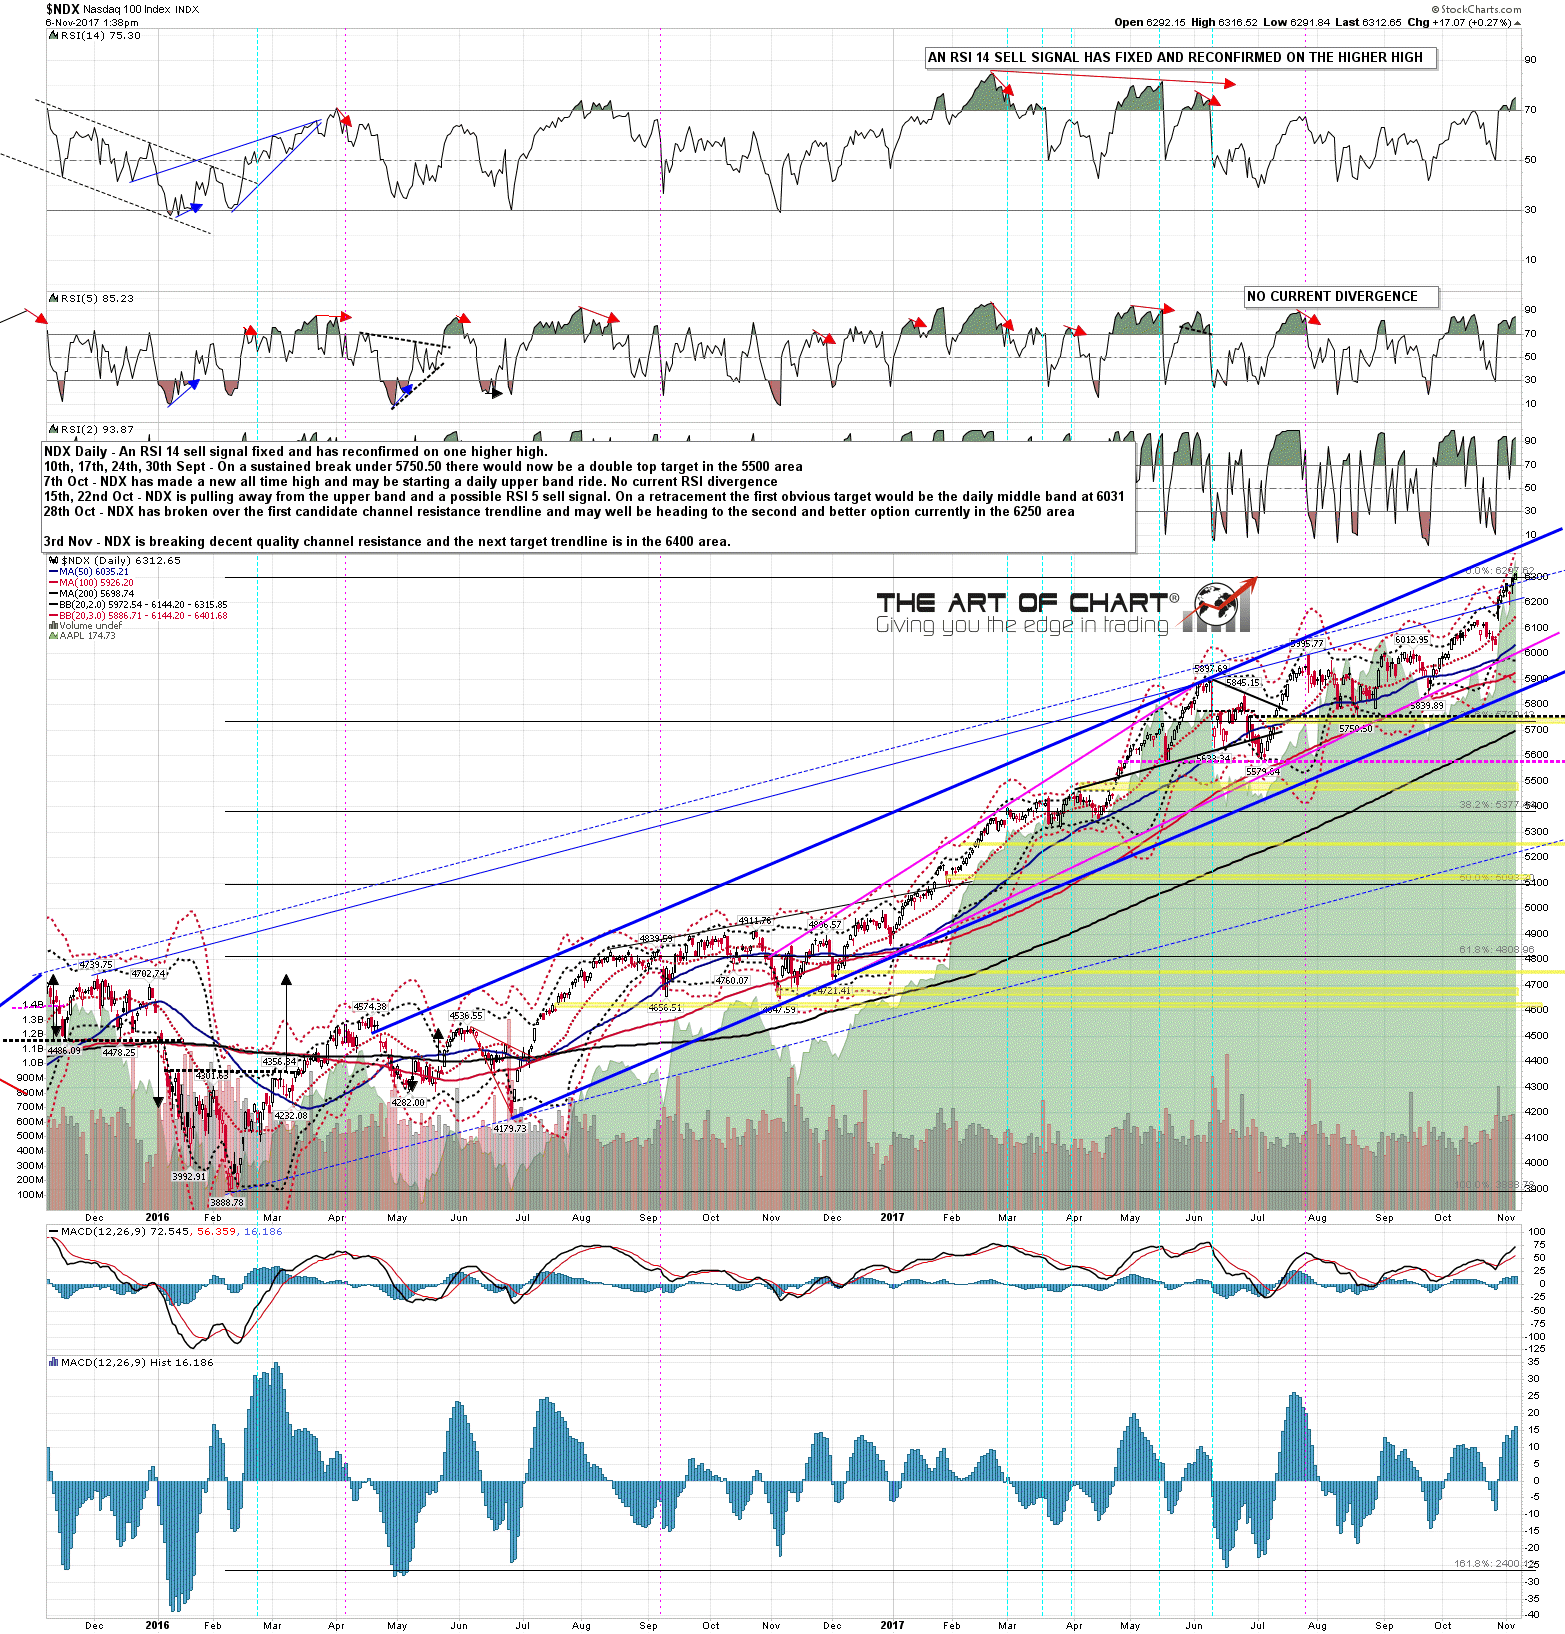
Trendline resistance has been broken on NDX and the next obvious trendline resistance on the daily chart is in the 6400 area. NDX daily chart:
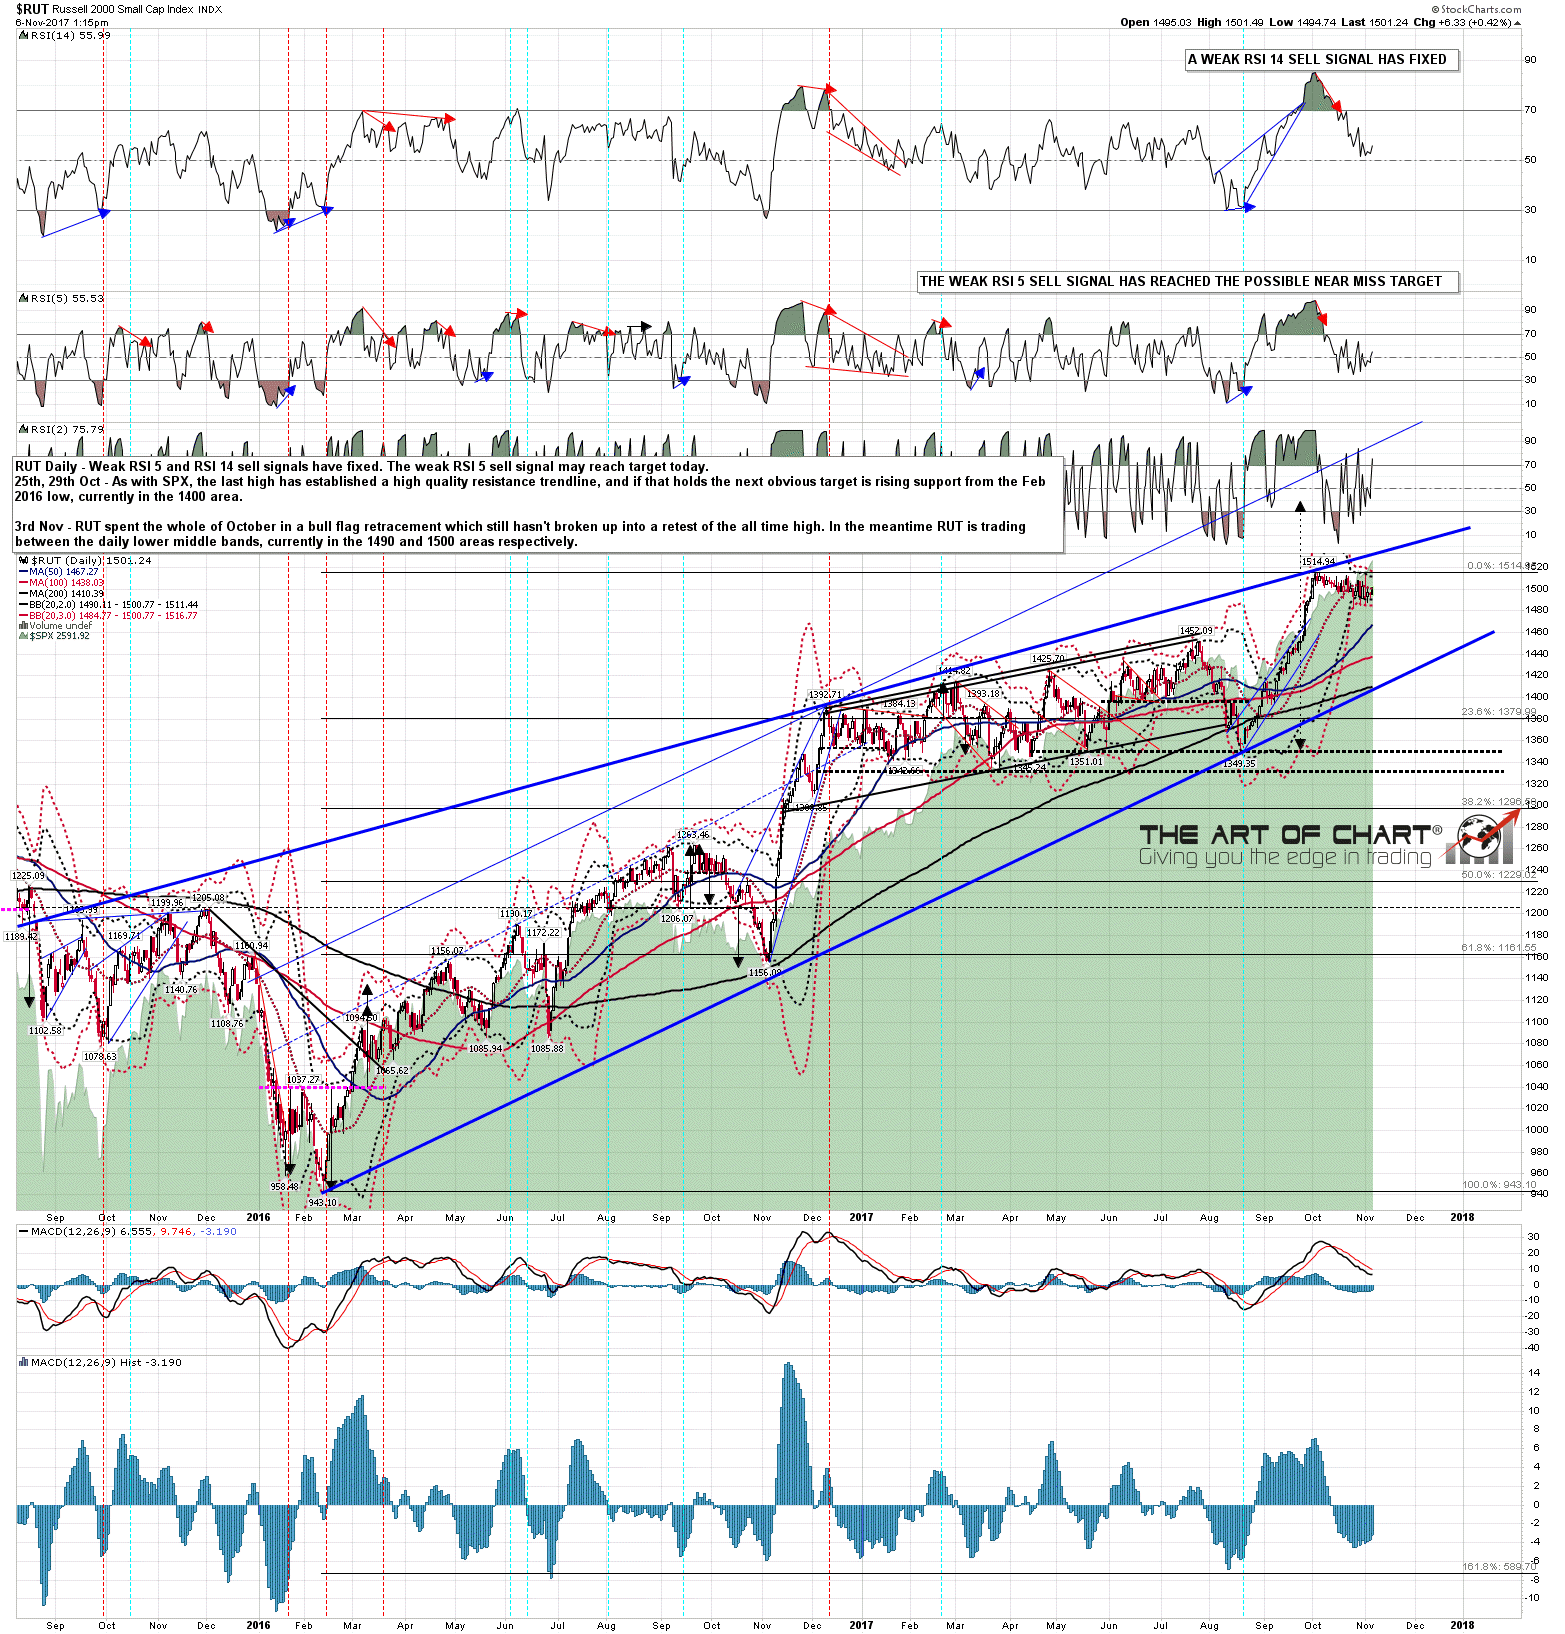
RUT has been in a likely bull flag retracement for five weeks now and this should end with at least a full retest of the all time high. It may be that no meaningful retracement on the indices can be seen before that happens. I first said that about three weeks ago I think, and it’s still likely to be the case. RUT daily chart:
So could this market get any duller? Hard, but perhaps not impossible. We’ll have to see. In the meantime this is a buy the dip market until that stops working.
