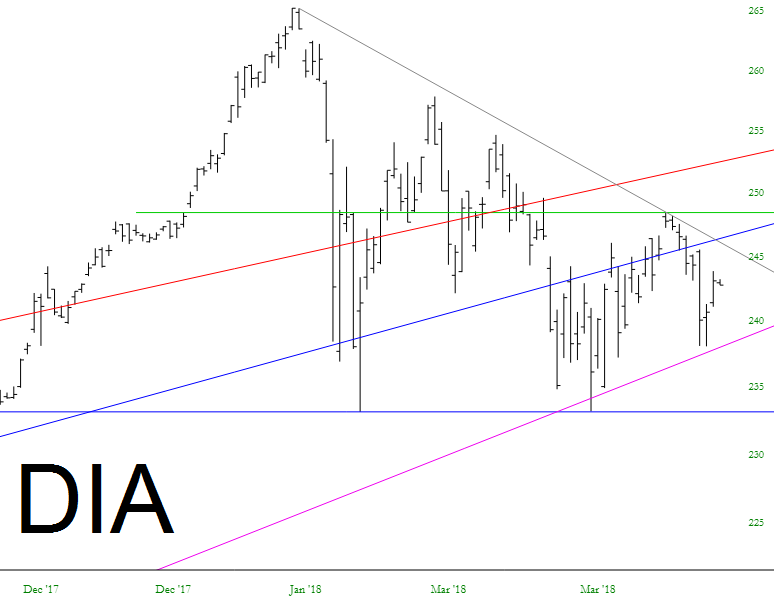
What an interesting trading day so far, eh? In order to extinguish the crazy ga-ga earnings rally going on with Amazon, I am at this very moment in Seattle, which seems to have done the trick. Even though the likes of INTC, MSFT, and AMZN went absolutely orgasmic after the earnings reports Thursday afternoon, the NQ is deeply in the red as of this moment. Although, let’s face it, Gartman’s two about-faces probably has more to do with the NASDAQ explosion and collapse than my own travels. The important point is that the market is still hemmed-in:
Slope of Hope Blog Posts
Slope initially began as a blog, so this is where most of the website’s content resides. Here we have tens of thousands of posts dating back over a decade. These are listed in reverse chronological order. Click on any category icon below to see posts tagged with that particular subject, or click on a word in the category cloud on the right side of the screen for more specific choices.
TGIF
I’m doing a morning post today as I’m hoping to take most of the afternoon off after a big webinar at lunchtime. Starting the weekend early. 🙂
ES/SPX broke back over the daily middle band yesterday and needs to confirm the break above with another close above today. That’s is currently in the 2655 area on both ES and SPX and is clear support. If we were to see a rejection back under there today then we might well see most or all of yesterday’s daily candle retraced, as that is seen very frequently on a middle band break and non-confirmation.
So the daily middle band is clear support today. Clear resistance is at the ES monthly and weekly pivots at 2678.75 and 2683.25. The high on ES yesterday was .at the monthly pivot test and if ES is going to fail there we would ideally see yesterday’s high tested this morning to establish negative RSI divergence, then a hard fail. (more…)
Dead-Cat Bounce or Higher Prices Ahead?
I last wrote about the SPX, 10YT and SPX:VIX ratio here.
After this morning’s (Thursday’s) gap up, and as at 1:00 pm ET, the S&P 500 Index (SPX) has popped back above its 2650 major resistance/support level, as shown on the following daily chart.
It’s back in the red zone in between 2700 and 2650, which form major resistance and support, respectively. Near-term resistance levels are 2673 and 2692 (formed by intersecting channel lines).
The momentum indicator is still below zero, so any further rally should bring it back above that level to support further SPX strength. Otherwise, beware of a potential “dead-cat bounce“ as price either stays mired in the red zone, or drops back below 2650, to, possibly, lower lows for the year. (more…)
My Cosby Memory
Back in the early 1980s, when I was still a kid, my family had a cable package that included Cinemax. One of the films it had was a comedy special called “Bill Cosby: Himself”, which was about an hour and a half of him doing stand-up. It was really the first comedy special I had ever watched (which began a lifelong love affair of such things), and I’ve found it for you here:
Breaking Back Over The Daily Middle Band
Stan and I are doing a free public webinar 30 minutes after the close tonight entitled ‘Turn Around Your Trading Part 3’ on turning TA into profitable trades. If you’d like to attend you can register for that on our April Free Webinars page. Stan and Suz will be following that with another webinar on option premium capture, and registration for that is on the same page.
SPX broke back under the daily middle band on SPX on Tuesday, and confirmed the break below at the close yesterday. If SPX breaks back above the daily middle band today, as seems likely at the time of writing, then that will need a confirming close back above tomorrow.
I posted the key declining resistance levels on SPX and ES on my twitter this morning and they were in the 2662 and 2670 areas respectively. The break above today opens a possible retest of last week’s highs and maybe higher. (more…)
