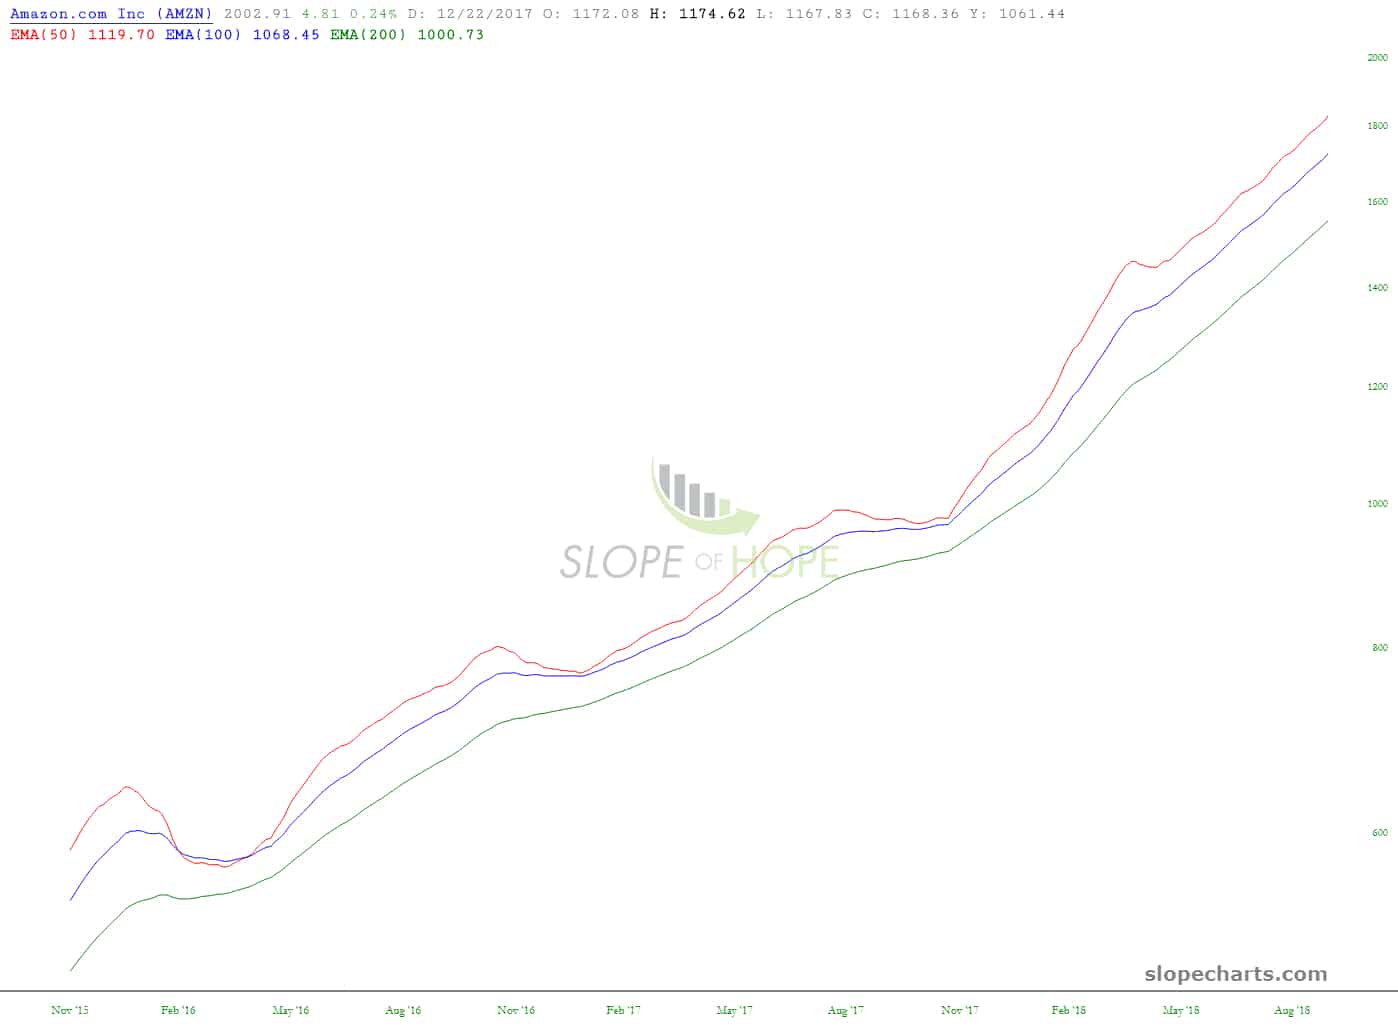
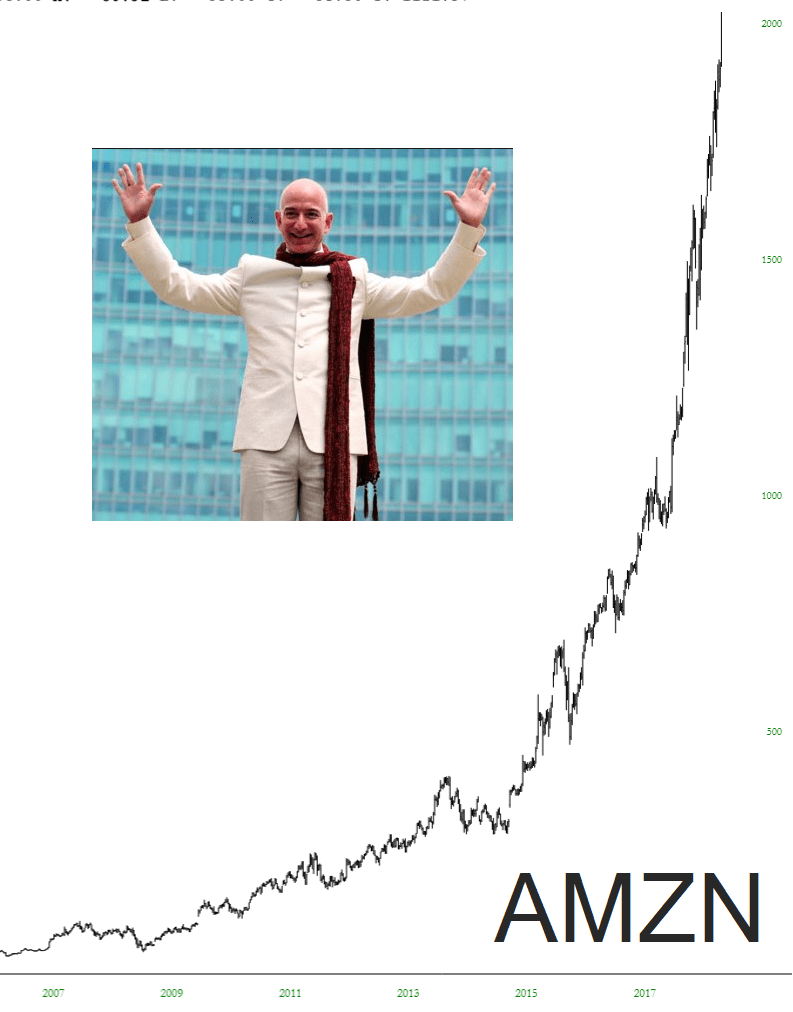
If there’s one thing I can show to swiftly illustrate the madness of the equity markets, it is the SlopeChart below. It represents Amazon’s trio of exponential moving averages (50, 100, 200). As you can see, there hasn’t been a single downside crossover………in THIRTY MONTHS. This, my friends, is what a one-way market looks like (and how a company gets to a trillion dollar market cap).
Slope of Hope Blog Posts
Slope initially began as a blog, so this is where most of the website’s content resides. Here we have tens of thousands of posts dating back over a decade. These are listed in reverse chronological order. Click on any category icon below to see posts tagged with that particular subject, or click on a word in the category cloud on the right side of the screen for more specific choices.
Mirror Image
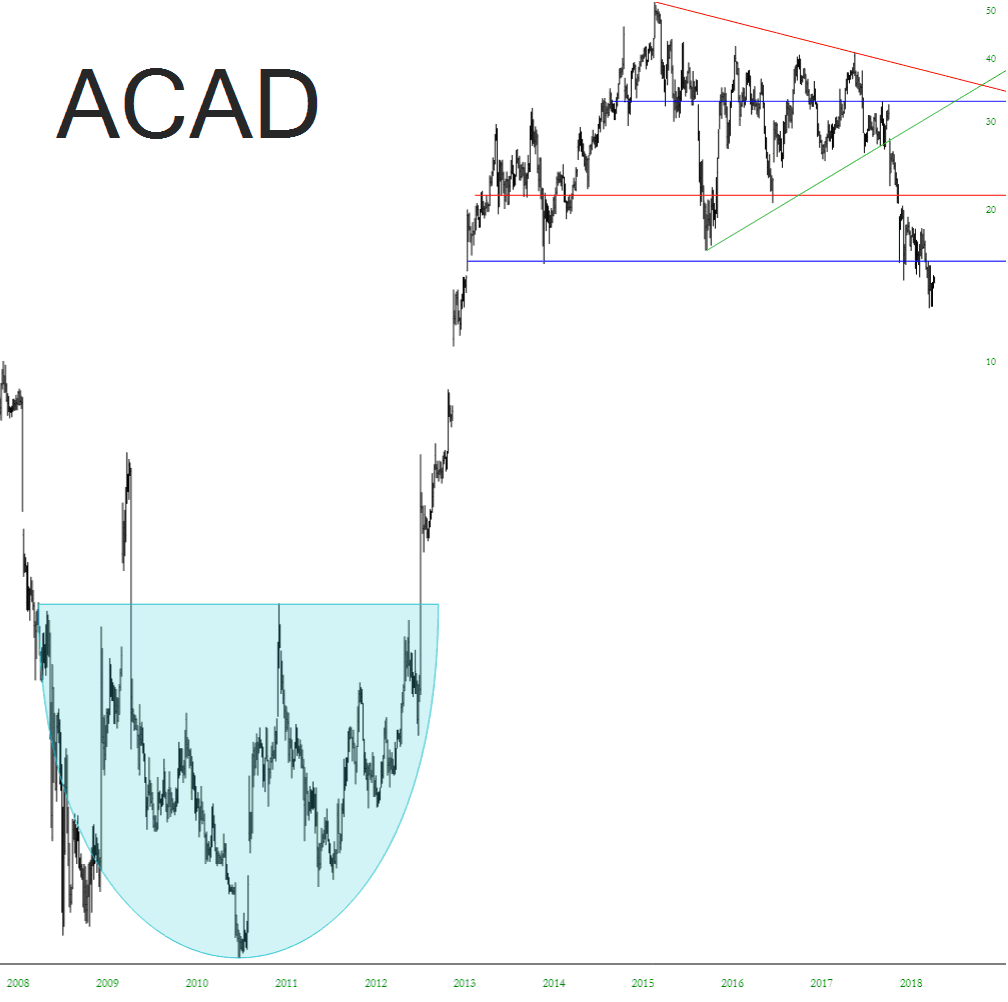
Given the success of recent picks lately (DLTR, BIG, TROX) I wanted to share another intriguing short setup, which is Acadia Pharmaceuticals. Its topping pattern right now seems to mirror perfectly its basing pattern from years ago. I anticipate much lower prices in the months ahead. Apparently their big product is a drug that combats hallucinations. This market could sure use some of those pills.
Dust-Up Follow-Up
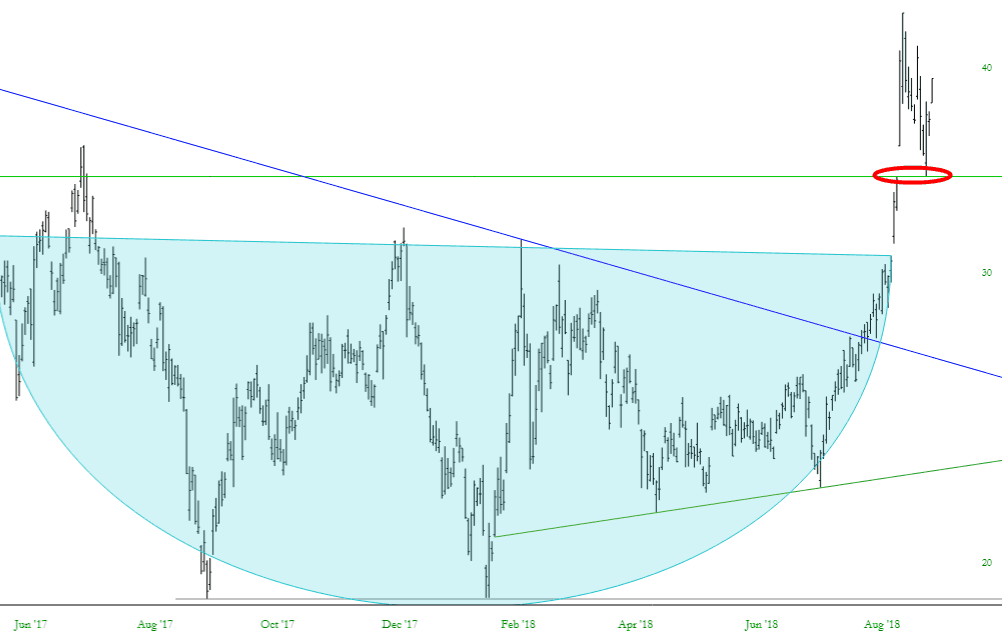
Just yesterday I was mentioning the very smooth basing power of ultra-bearish fund DUST, shown below. I’ve circled the price gap. It is adding to its gains from yesterday. It just seems the so-called precious metals sector, after seven years in its own bear market, can’t get up off the carpet.
People Still Can’t Get Enough Of It
Words fail me.
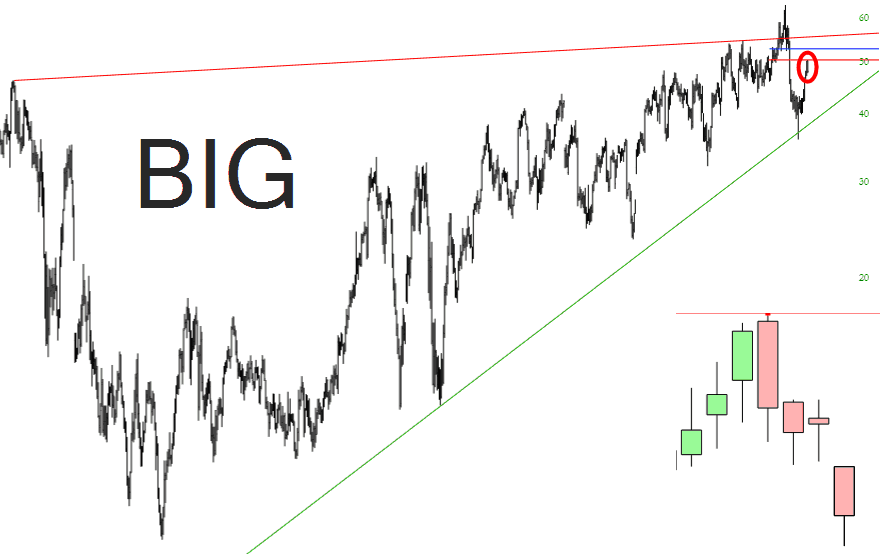
Go Big or Go Home
I’ve got a couple of real winners (that is to say, losers) in my world today – – DLTR, down about 10%, and BIG. I’ve suggested both as shorts many times, but I wanted to hit on BIG again, because I think it’s going to be a dynamite failure with much lower prices to come.