I’m on my way to the San Francisco Money Show right now, where I hope to spend a little time with my Tastytrade colleagues (which only happens about once a year). I’m bouncing along a train right now trying to hack together something resembling a post, so I’ll share a few thoughts on some ETF charts I find more interesting than the others.
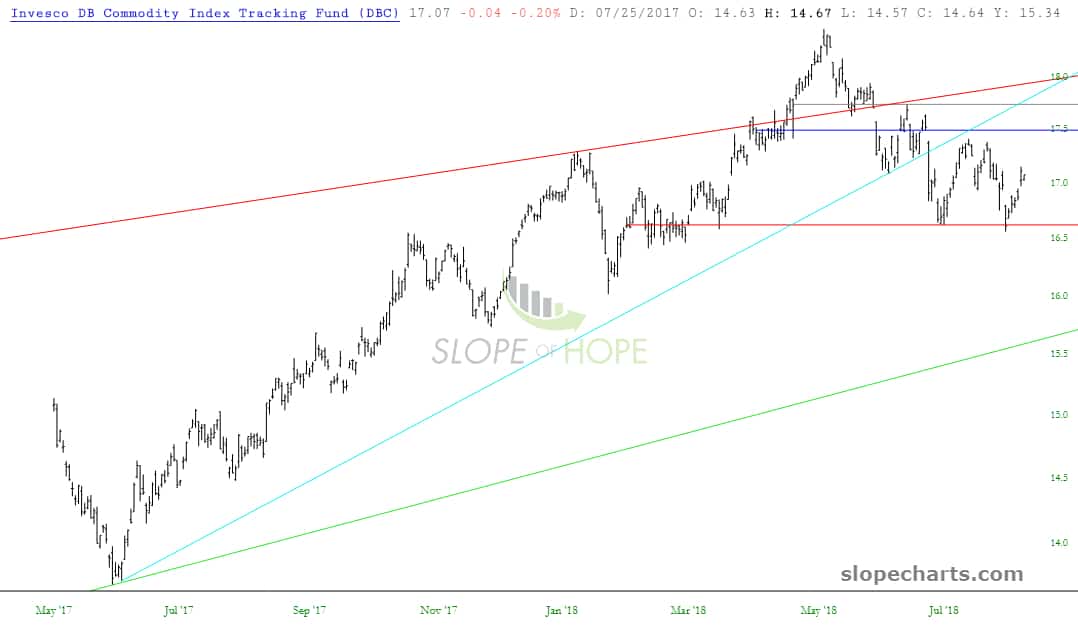
First up is the commodity ETF symbol DBC, which is forming a beautiful top; it looks like the pattern is about 90% done. Here’s hoping for a break beneath that horizontal.
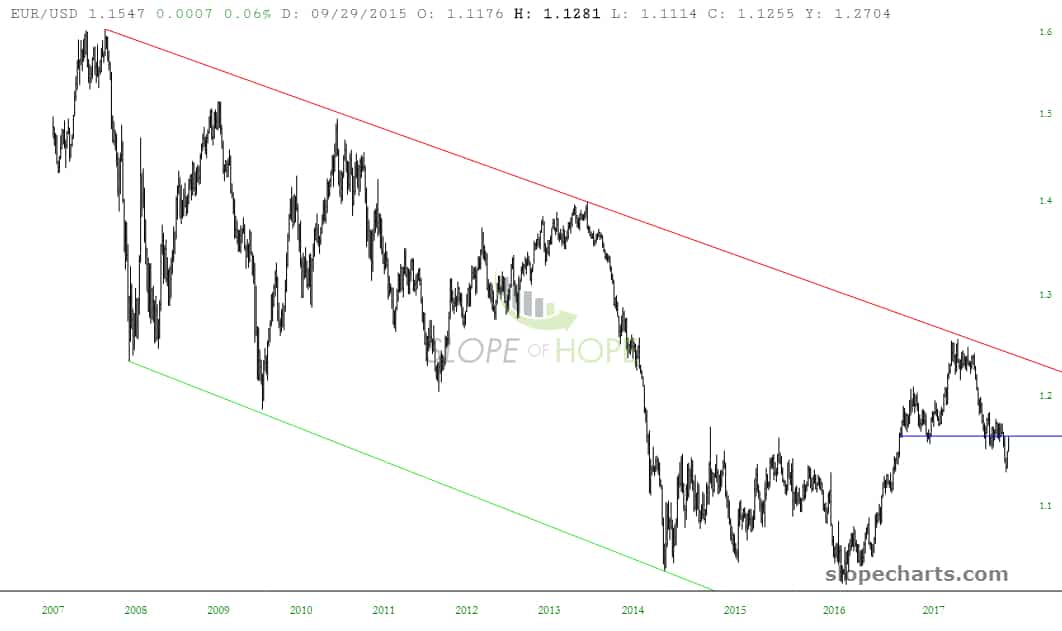
I realize EUR/USD isn’t an ETF, but I wanted to use it to mentioned something else: I believe the Euro is going to start pushing lower, and that’s going to drag emerging markets with it (as if they needed any other anchor this year).
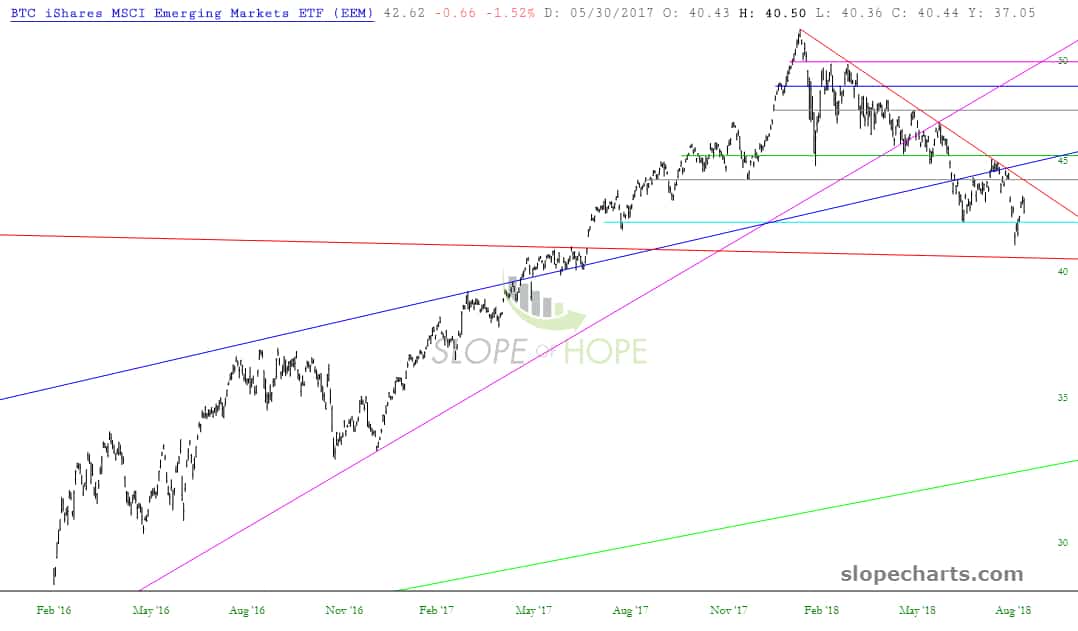
Here’s the biggest of the big when it comes to emerging markets trading, symbol EEM, which has been steadfastly banging down lower highs almost the entire year (what I wouldn’t give for our own markets to be doing the same). This is what a bear market looks like, ladies and gentlemen.
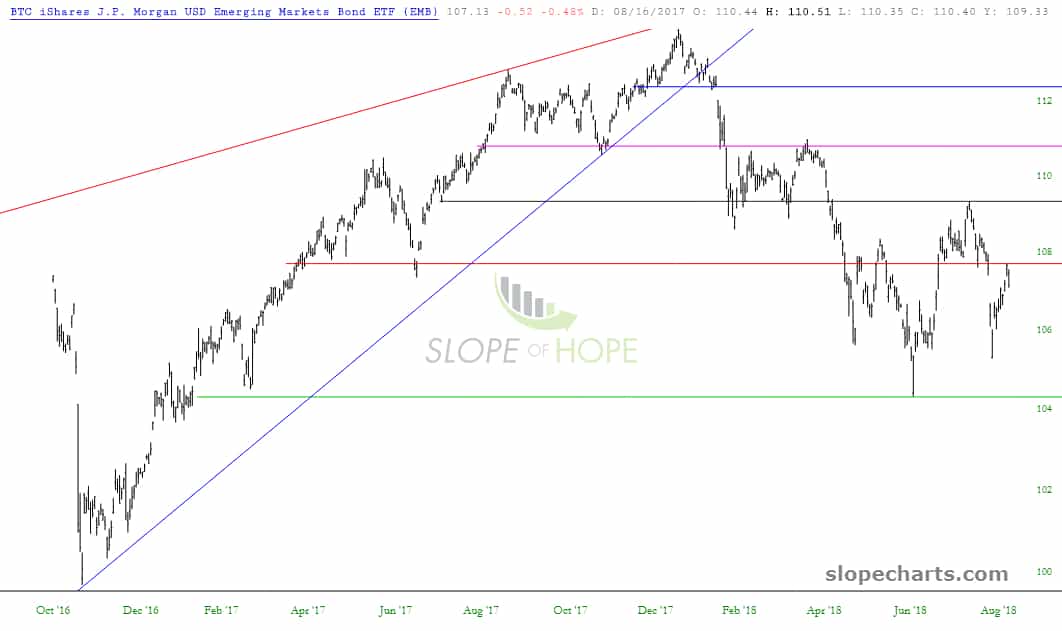
An associated item which I’m short is EMB, the emerging markets bond fund.
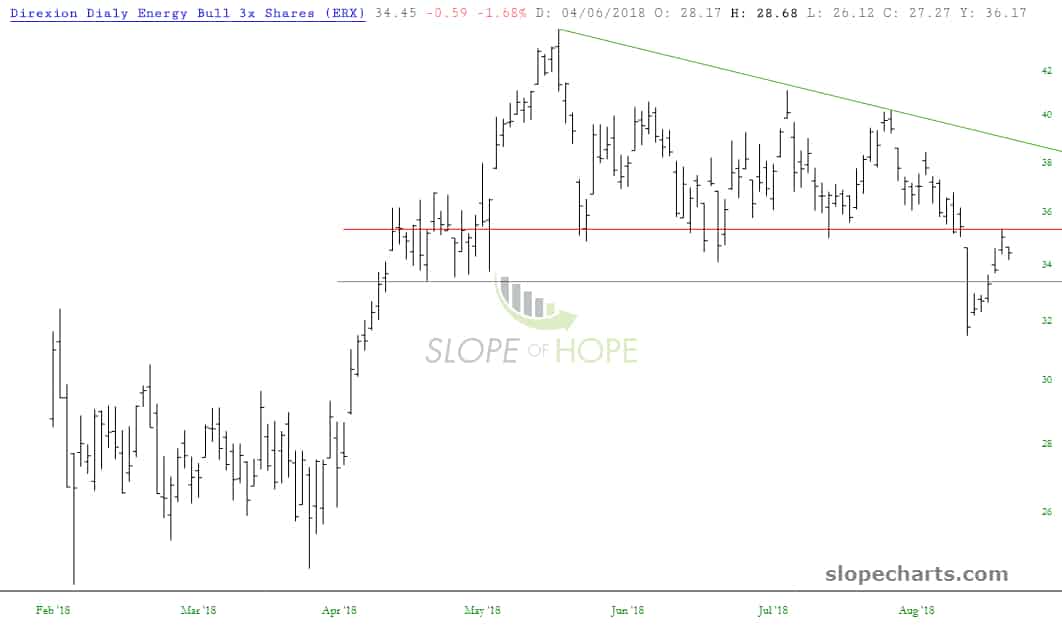
Changing topics for a moment, energy is definitely one of my favorite sectors to short, and I think this broken right triangle of ERX shows neatly what a clean cloud of over head supply exists above present price levels.
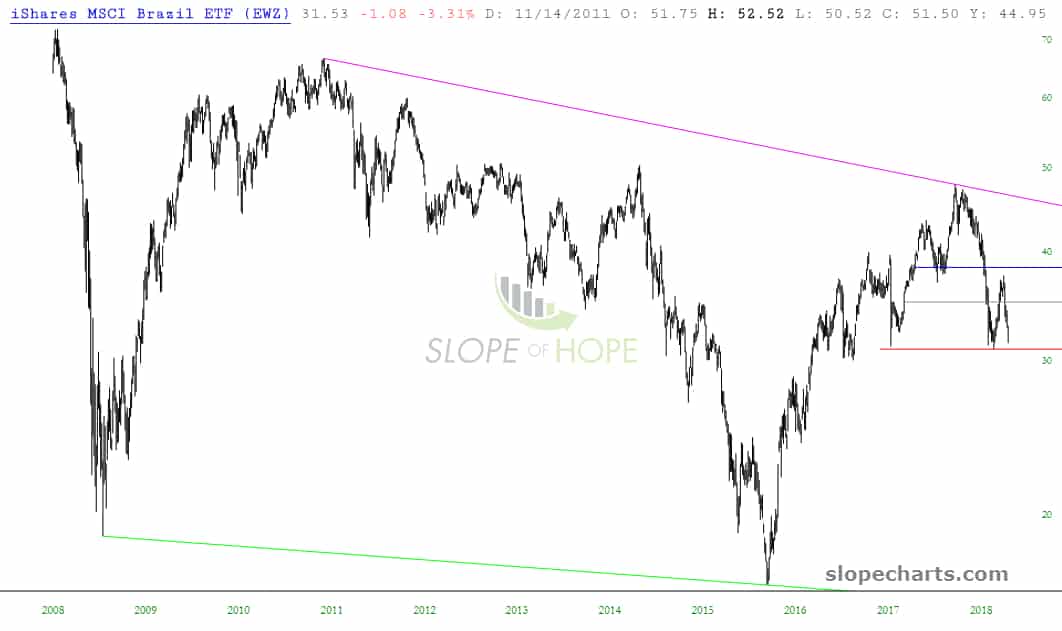
Going back to non-U.S. markets, Brazil is just a basket case. Even with emerging markets were (very temporarily) recovering last week, Brazil refused to participate. A break below the horizontal would portend a succession of much lower levels. This is a gorgeous chart.
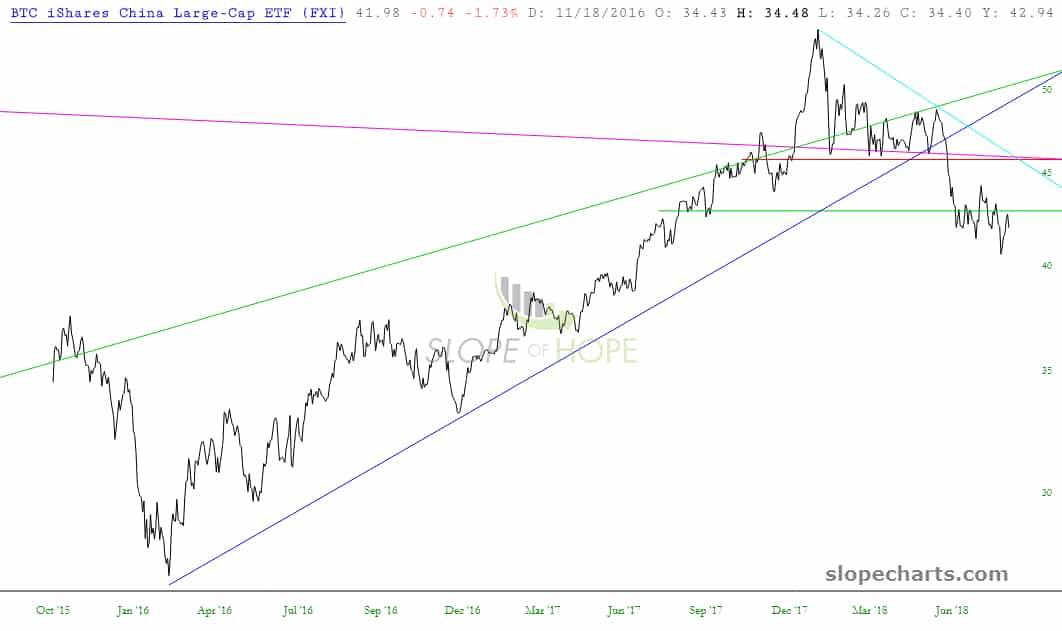
While I was bouncing along the train, I saw news that the Chinese trade delegations were saying that talks were going along well and progress was being made. As of this moment, the ES is up 0.04%, so I guess the market isn’t exactly orgasmic over this “news”. Anyway, the Chinese stock market looks like it has a case of swine flu.
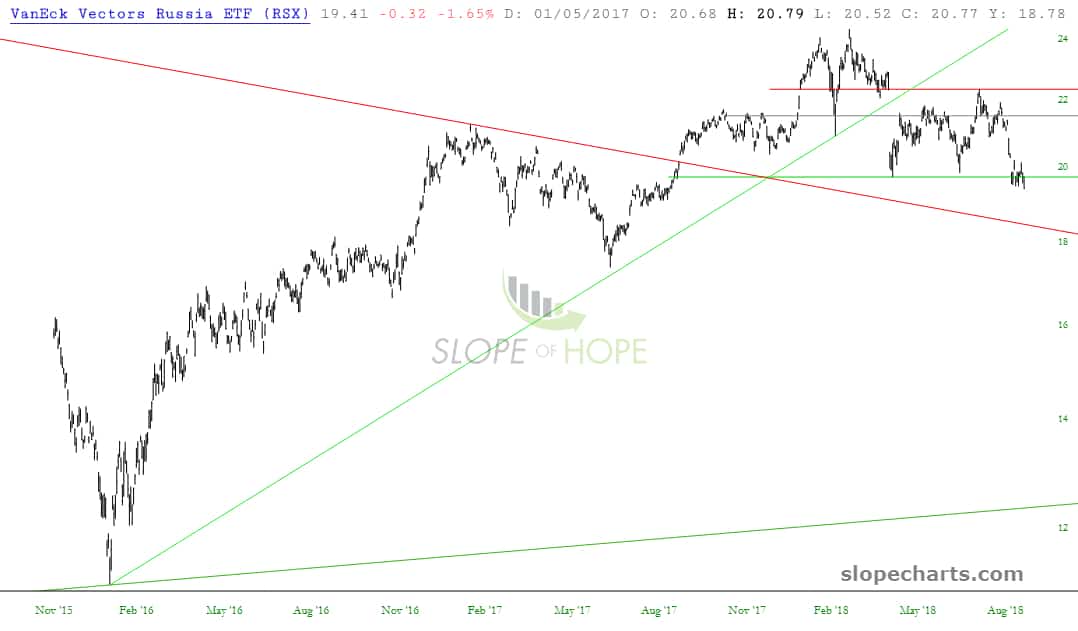
And newfound ally to China, Russia, is equally vulnerable. That green horizontal is the only thing standing between present prices and tumble-town.
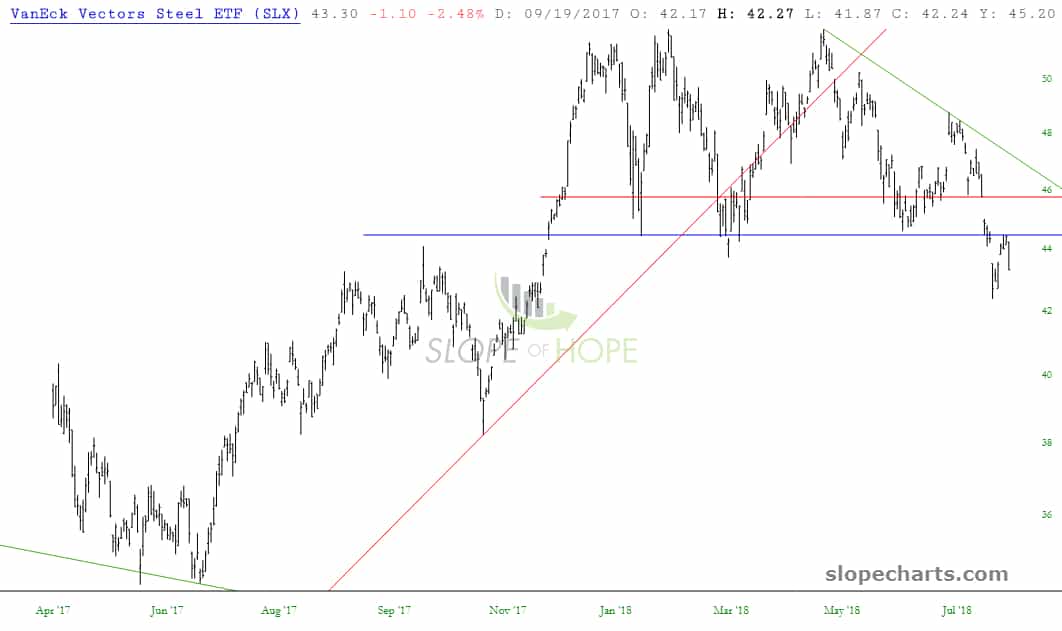
Finally, before my laptop battery dies, here is the steel sector, symbol SLX, which bears a surprising resemblance to just about every other chart I’ve shown above. Anyway, time to socialize a bit with my virtual colleagues. See you on Friday!