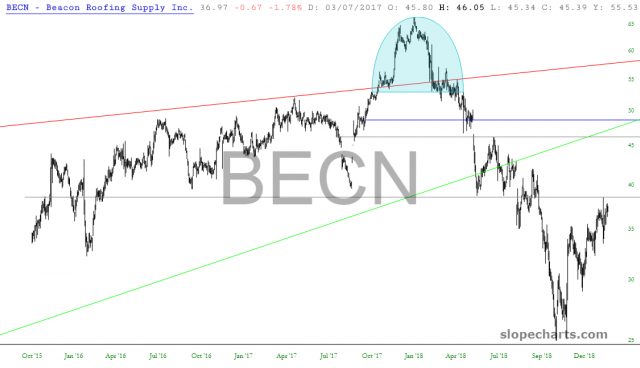
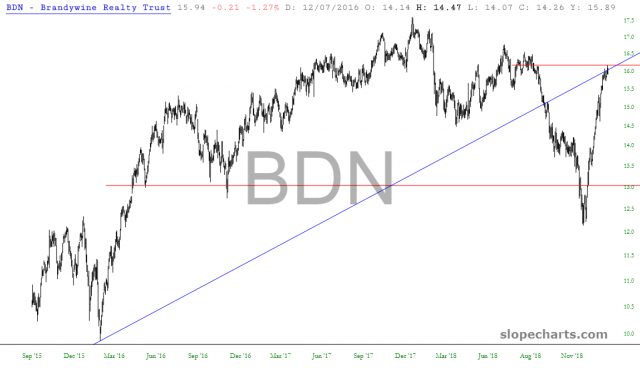
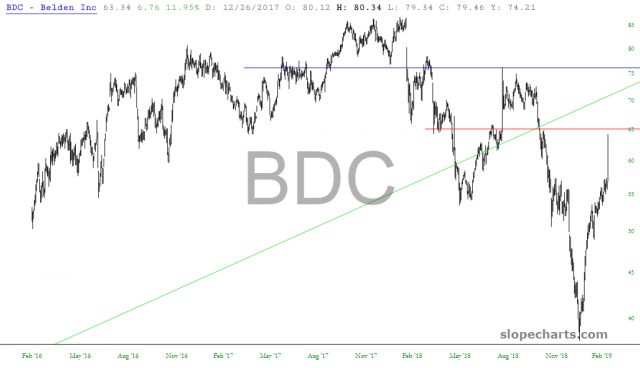
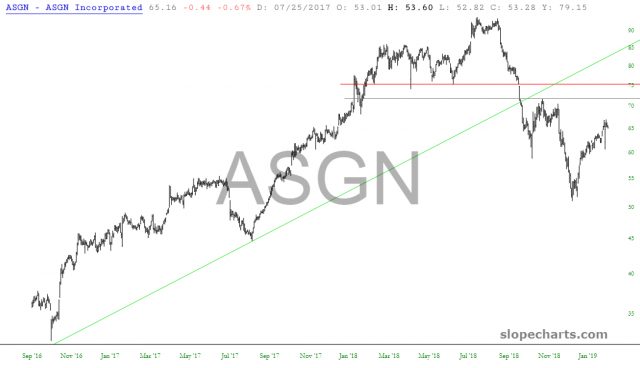
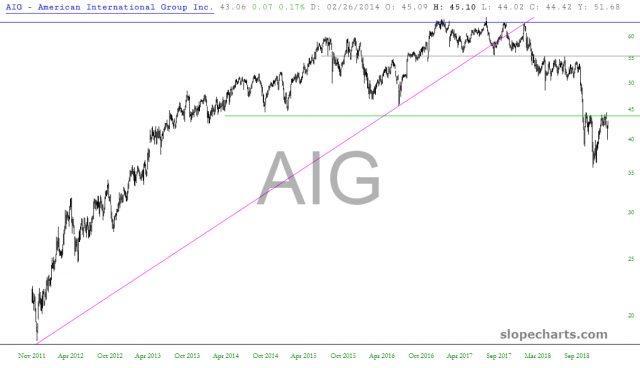
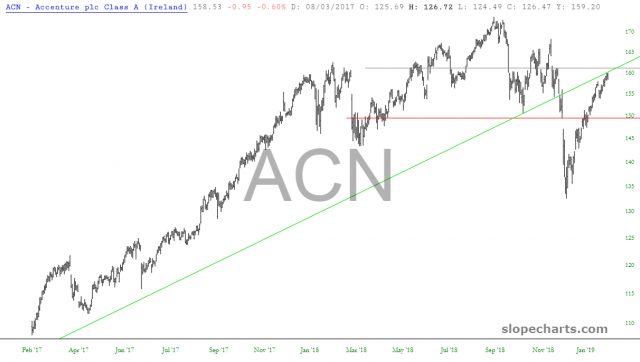
Even with the looming danger of the Fed Minutes at hand, I wanted to share nine charts (complete with easy-to-read ticker symbols) that seem to be intriguing short candidates.
Slope of Hope Blog Posts
Slope initially began as a blog, so this is where most of the website’s content resides. Here we have tens of thousands of posts dating back over a decade. These are listed in reverse chronological order. Click on any category icon below to see posts tagged with that particular subject, or click on a word in the category cloud on the right side of the screen for more specific choices.
Consumer Diamond
There is no shortage of interesting patterns right now. One of my favorite continues to be the Consumer Staples Select, which is featuring a very handsome diamond reversal pattern. Here you can see it on the long-term chart. I have used the polygon tool in SlopeCharts to highlight it.

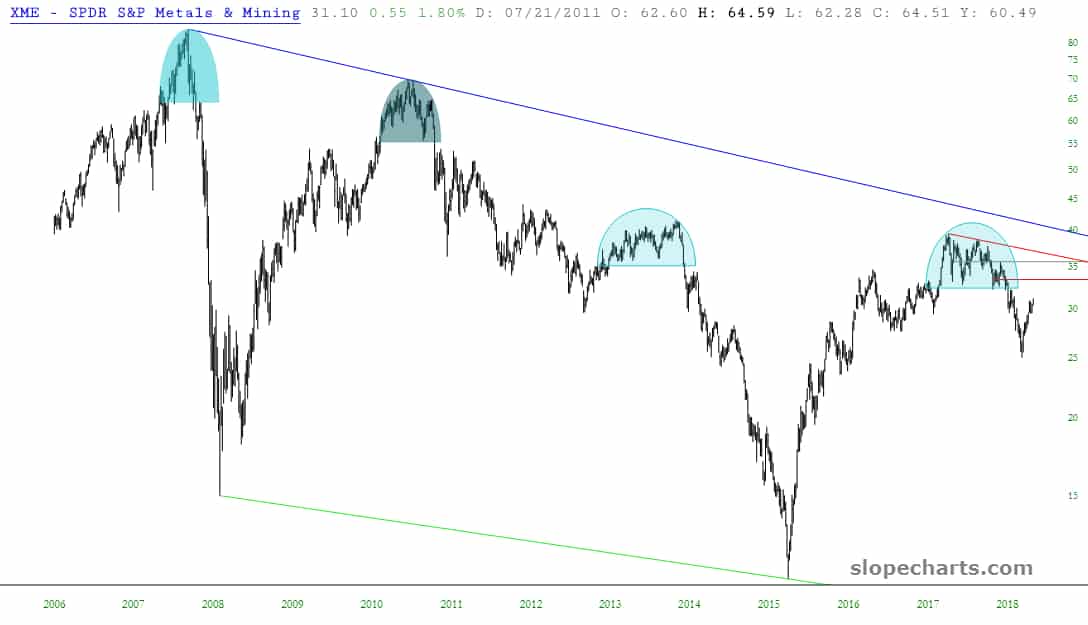
Mining Number Four
Greetings from Harvard University. I flew across the very, very wide United States of America last night and will be spending the day here before heading back home. So I’m going to spend 50% of a 24-hour period on a plane seat.
I wanted to revisit the Metals & Mining ETF, symbol XME, which, in spite of the tremendous rise for the past nine weeks is still sporting a very well-formed reversal pattern. I consider this rally to be countertrend.
Push, Push…
First, a warning: I’m going to be on a whirlwind across-the-country trip tomorrow, so I will probably not be as prolific as normal. In the span of 24 hours I’m going to fly across the U.S., have some meetings, and fly all the way back home. Ugh. But I wanted you to know.
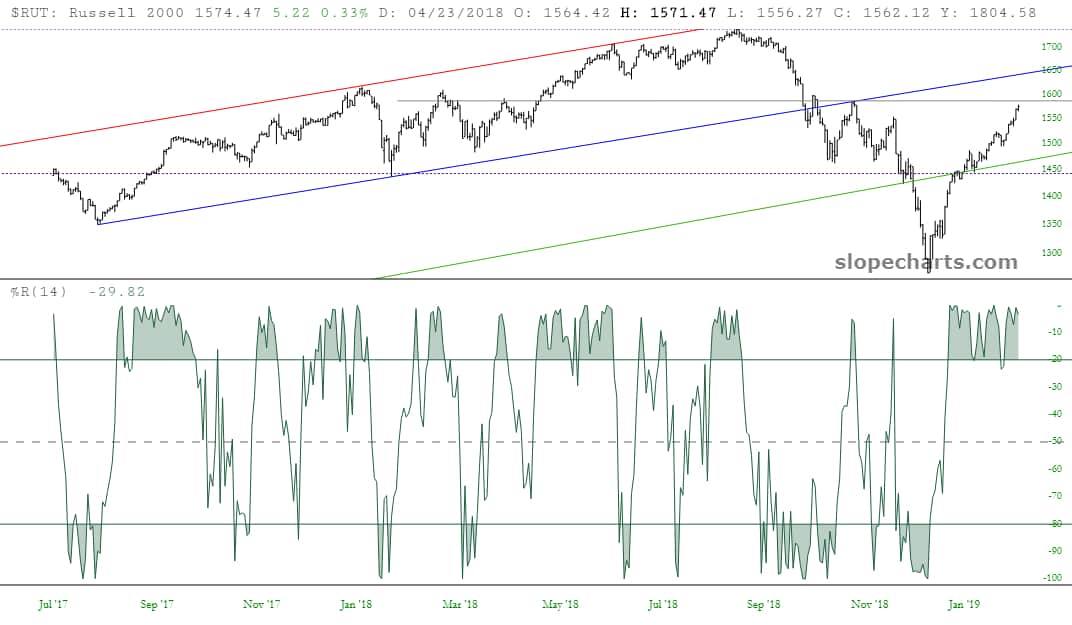
Speaking of “ugh”, the markets continue to creep higher, sometimes a lot, sometimes a little. Today was one of the “little” days. The overbought indicators are very stretched, as you’ll see below, but overbought readings can stay overbought for a long time. They are by no means a guarantee of a reversal.
Fine Charts and Great Coffee
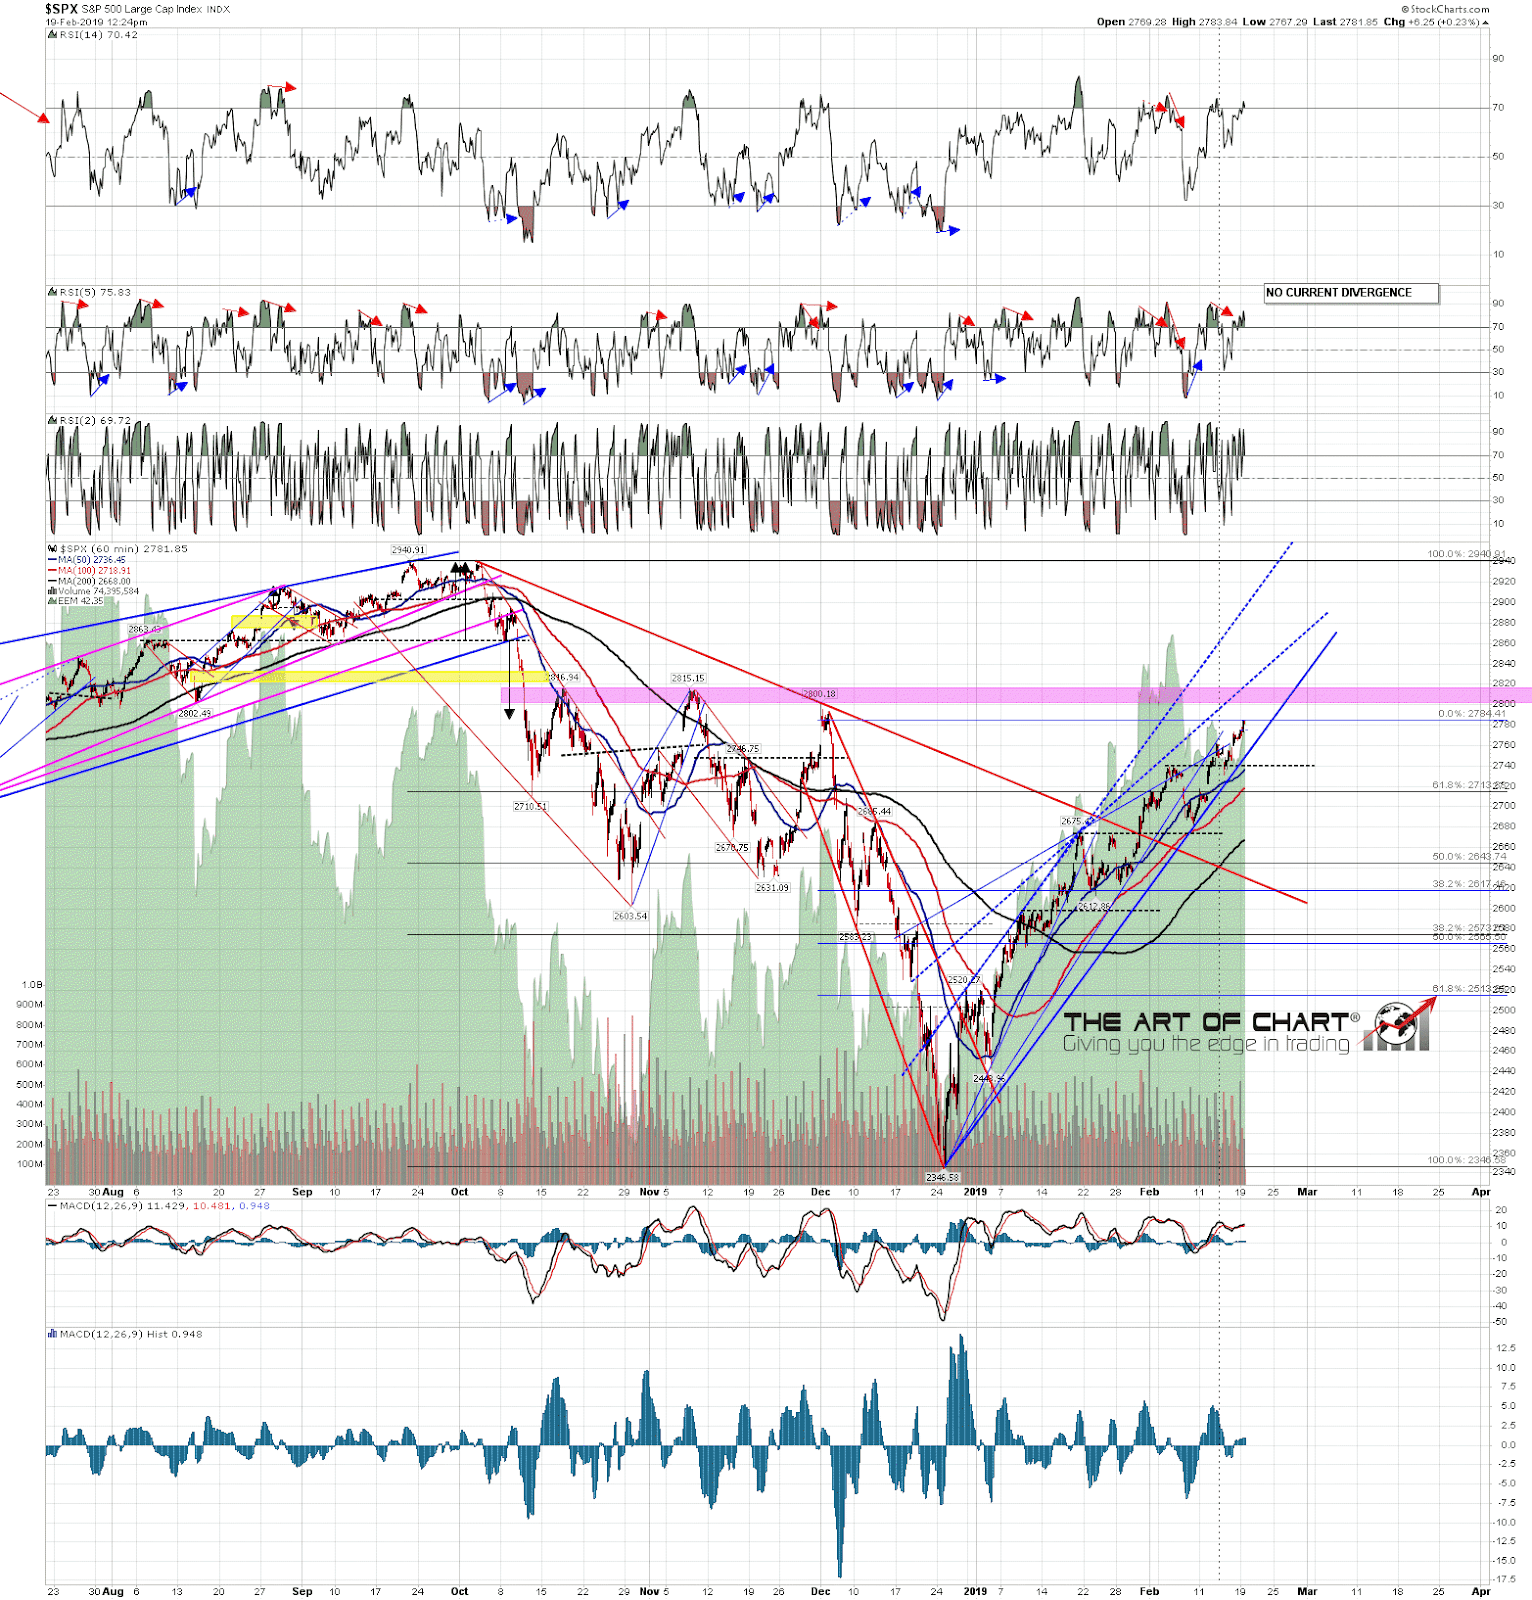
If you read my post on Friday talking about the rising channel on SPX that could deliver an all time high retest within weeks, then you know what I see as the key support level on SPX and that is of course that rising channel support trendline, now in the 2750 area and rising at about 42 handles per week. Until that breaks there’s really not much to talk about on the short side on equity indices.
I would note the resistance area above that is the last really significant resistance area before a retest of the all time high. That area is the ceiling established by three rallies Oct-Nov last year and those three highs were all in the narrow range 2800-17. A break and conversion of that area clears the way for the possible all time high retest that may be coming soon, and SPX is now getting close to retesting 2800.
SPX 60min chart: