
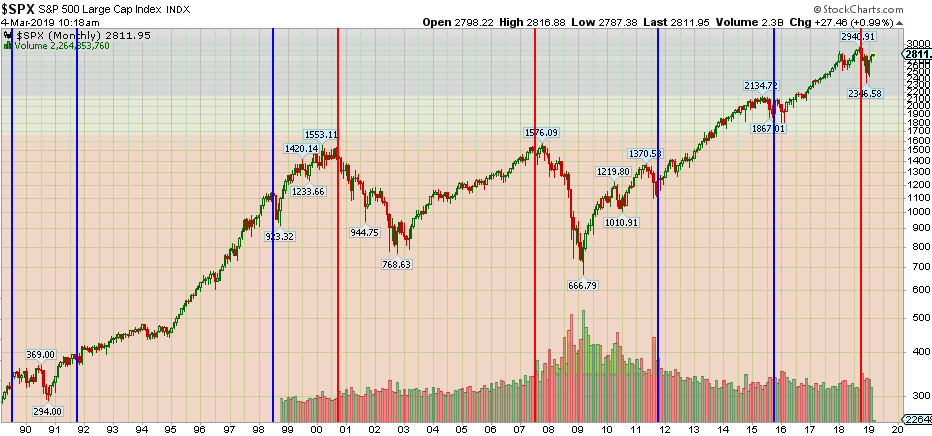
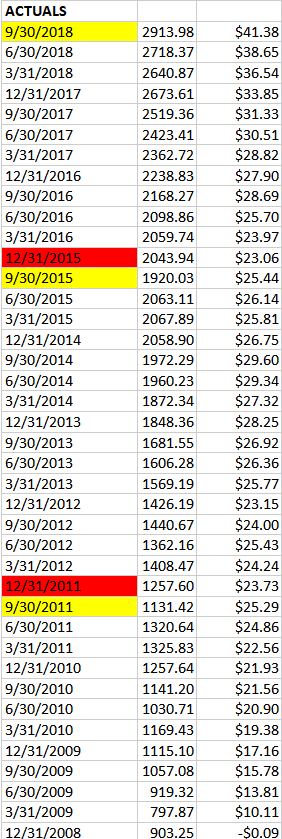
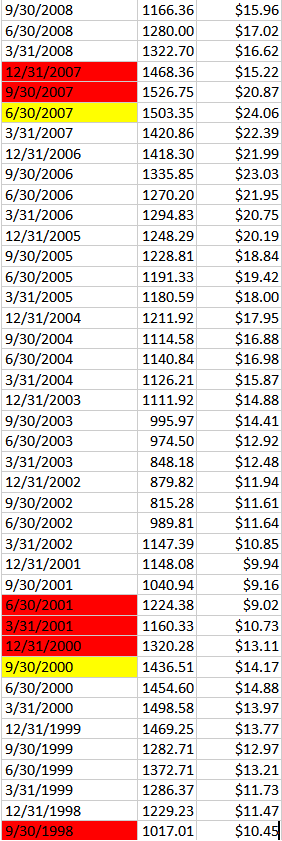
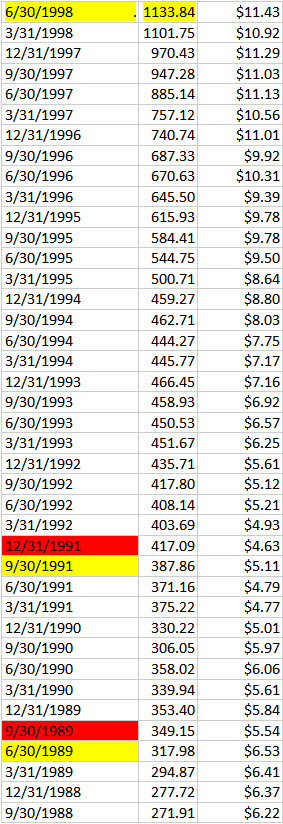
Contributed by Hedge Fund Tips: In the past 30 years, we have had 7 instances of sequential S&P operating earnings drops of 6% or greater (data table below highlights sequential drops in yellow/red). In each case, it was not a positive – and a stock market correction reflected the downturn in economic activity.
There is a KEY distinction when referring to sequential operating earnings declines:
In 5 out of the 7 times, the sequential drop was limited to 1 quarter (SEE Blue Vertical Lines Above) – meaning the following quarter came in above the previous quarter where there was a precipitous operating earnings drop of more than 6% sequentially.
In those 5 instances, the market recovered after the correction and did not make new lows.
In the 2 of 7 times that you had sequential earnings drops of 6% or greater AND the quarter AFTER the big drop was also lower by ANY amount, it led to lower lows and continued deterioration (SEE RED VERTICAL LINES ABOVE).
Why is this important?
From Q3 2018 to Q4 2018 we had the first S&P 500 sequential operating earnings drop of 15.34%. We also got a big stock market correction of ~20% to go along with it in December. In 5 out of 7 instances, it’s not a problem. Maybe you partially retrace the bounce before making eventual new highs (like 2011), but the low is in.
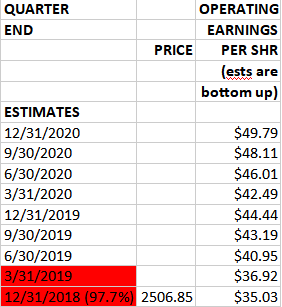
This time is potentially worrisome and here is why: At present, operating earnings for the S&P 500 for Q1 2019 are expected to come in slightly above Q4 at $36.92 from Q4 2018 operating earnings of $35.03. In theory we should be in the clear. However the call for caution is predicated on the fact that just 4 weeks ago Q4 operating earnings were at $38.32 and they finished ~$3.29 lower ($35.03). So while “AS REPORTED” earnings usually BEAT expectations by ~3% (and we are currently tracking for -3.7% year on year estimates for “as reported” implying ~flat year on year), OPERATING EARNINGS -which cannot be massaged – would be negative sequentially if we get anything like the $3.29 drop we saw in the last four weeks of the Q4 reporting period in the Q1 2019 reporting period. That type of drop would take Q1 operating earnings to ~$33.63 or a second sequential quarter of operating earnings decline.
This only happened in 2007 and 2000. Keep in mind, 2 instances is not a large enough sample to expect the same result with certainty – but it is enough to be mindful and WATCH it carefully (earnings for Q1 2019).
If we get a second quarter of sequential operating earnings drop, it would potentially signal an underlying deterioration in the economy last seen only in 2007 and 2000 (and preceded major lower lows in the stock market). I do not think we will get a 2nd sequential drop in Operating Earnings (Q4 2018 to Q1 2019) but it will come in VERY close. Here is the earnings data with sequential drops highlighted when yellow turns to red:
Here’s the offsetting good news – hence the Bull vs. Bear Death Match:
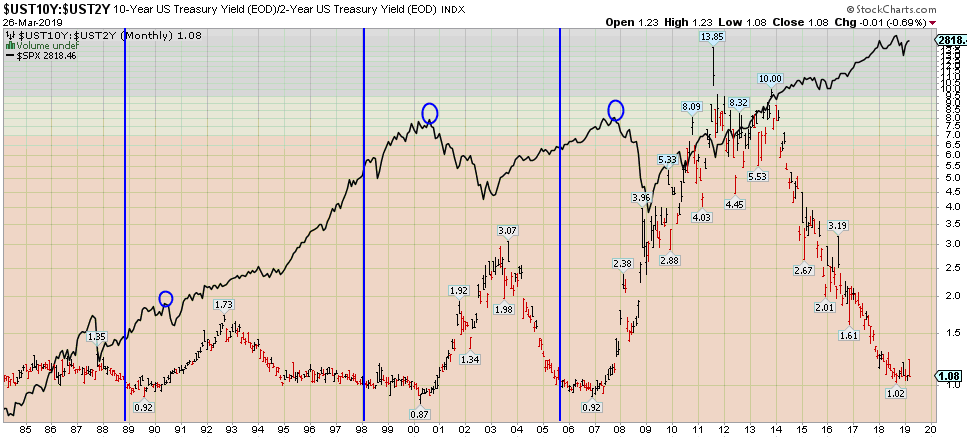
The yield curve (as defined by the 2/10 spread) has not yet inverted. In the chart above, it shows the three times in the past 30 years that the yield curve has inverted (represented by blue vertical lines): November 1988, February 1998, and September 2005. What is the common denominator?
The stock market ran for ~2 years AFTER the 2/10 inversion BEFORE the stock market peaked (represented by blue circles). We came AWFULLY close to inverting at 1.02 in September of 2018 (below 1.0 is inversion), but we did not invert. Do you want to know the last time we came that close without inverting? December 1994.
In both cases the Fed realized they had moved too fast after 2 years of raises and changed course on the dime. In 1995 Greenspan implemented 3 quick cuts before raising again and extended the cycle by 5 years. In January 2019 Powell did an about face and paused. The question is whether or not he will be as quick as Greenspan was in admitting his error and correcting it. Pausing is not the same as easing – particularly when Quantitative Tightening is still proceeding in the background until Fall of this year.
So where does that leave us? The yield curve says we have ample time to run, but earnings are signaling a “make or break” in Q1. The only thing we can do is see how the data comes in and adjust with the facts.
If we avoid the second sequential drop in operating earnings (which would require a > 4.15% drop in operating earnings yoy – Q1 2018 was $36.54), that would imply the lows of December should hold for some time and if past is any prologue the peak of the market should be 1.5-2yrs after the 2yr Treasury and 10yr Treasury inverts (getting close).
I think the likely outcome is a partial retrace of Jan/Feb gains and then we stabilize and move forward, BUT we need to see sequential earnings recover and estimates start to improve. If the 2nd sequential drop manifests (less than 50% probability), I would get more defensive moving forward.
