Tuesday was a fairly humdrum day, so instead of focusing on any stocks in particular, I went through my 57 ETF charts and plucked out the ones I thought were most intriguing. I’ll say a few words about each one, and I’ve laid them out in alphabetical order.
Brazil, symbol EWZ, has almost closed its price gap. This could be an interesting, albeit modest, short setup, as it finally broken below its range.

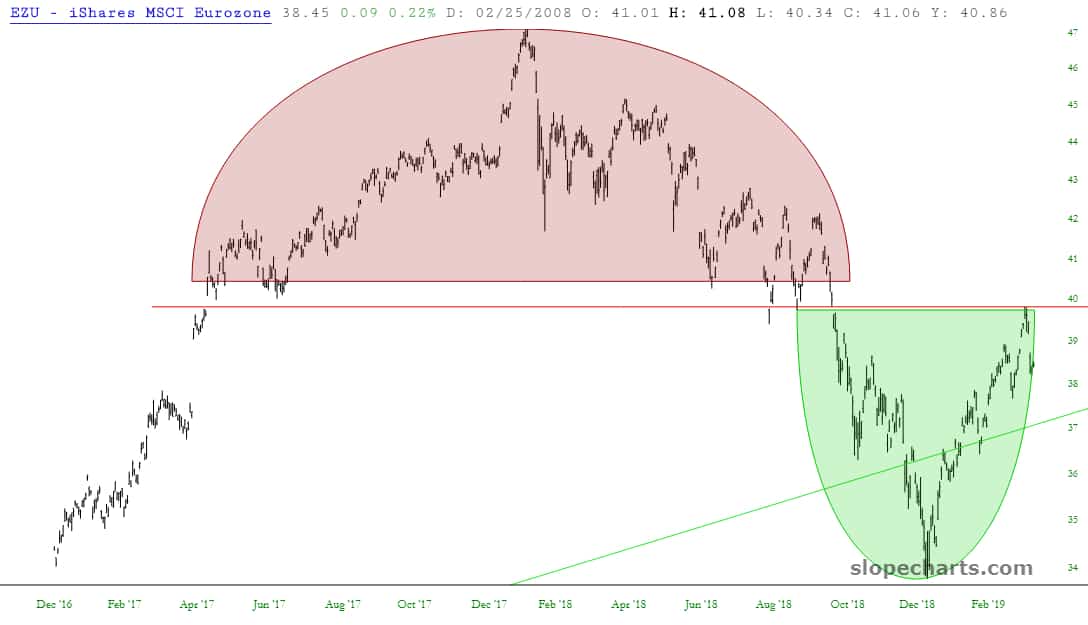
The MSCI Eurozone, EZU, is a fascinating battle, as the bearish topping pattern (red) is facing off against the smaller, but still well-formed, bullish reversal pattern (green). The dividing line is plain as day.
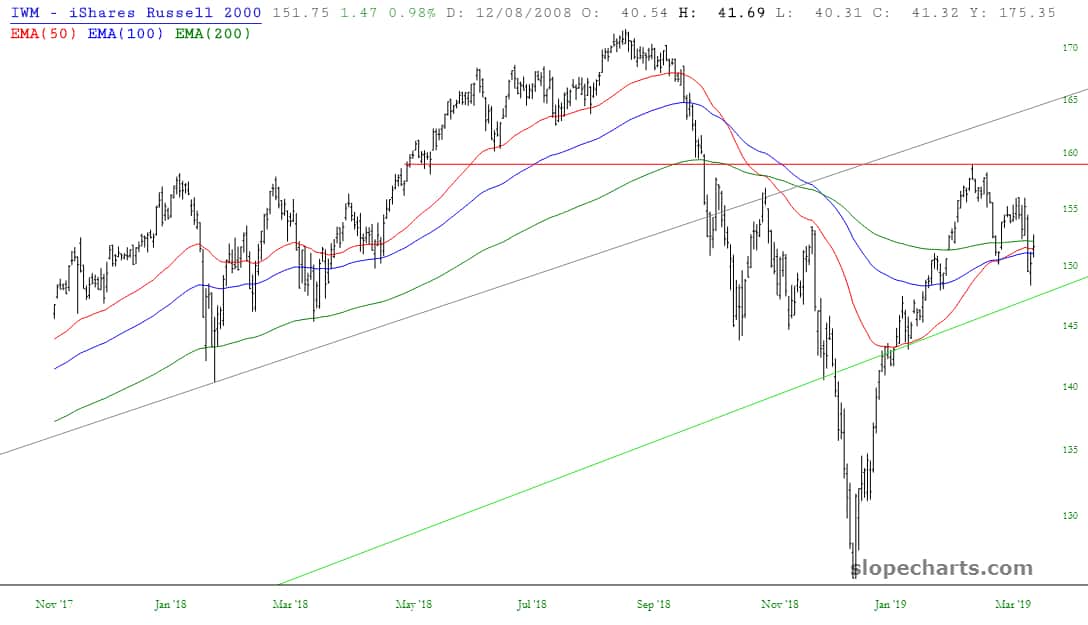
The small caps, by way of IWM, have seen their three moving averages converge more tightly than they’ve been in years. Uncertainty is in the air!
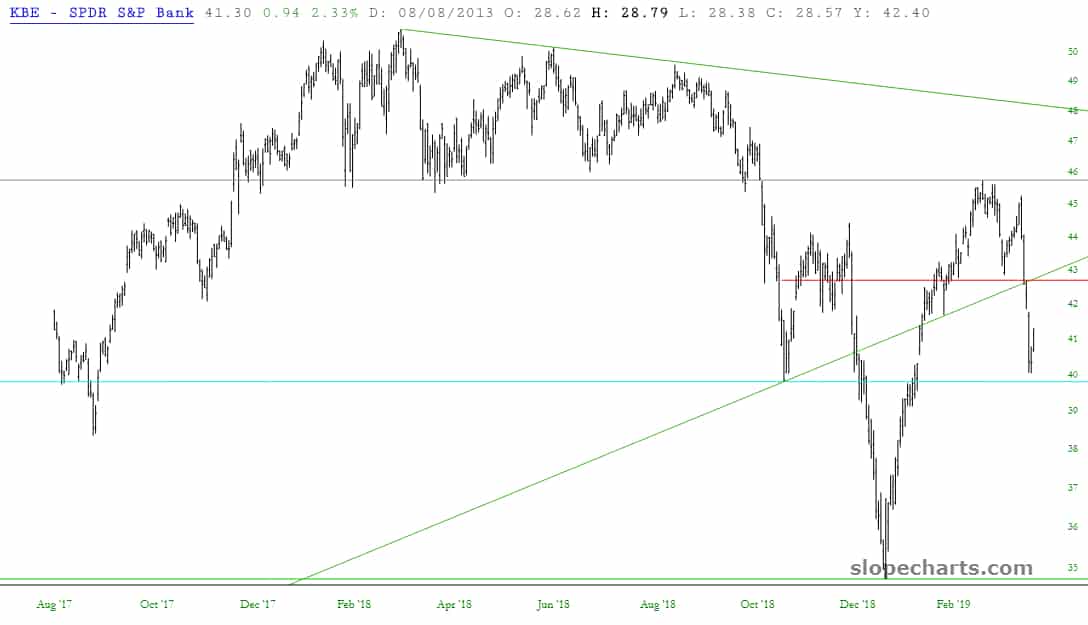
I’ve called out financial ETFs before, such as the very important KBE, and I’d say this price action is hemmed in between the cyan and red horizontal lines I’ve drawn. Obviously I am rooting for a breakdown beneath the left shoulder (basically falling under last Friday’s low).
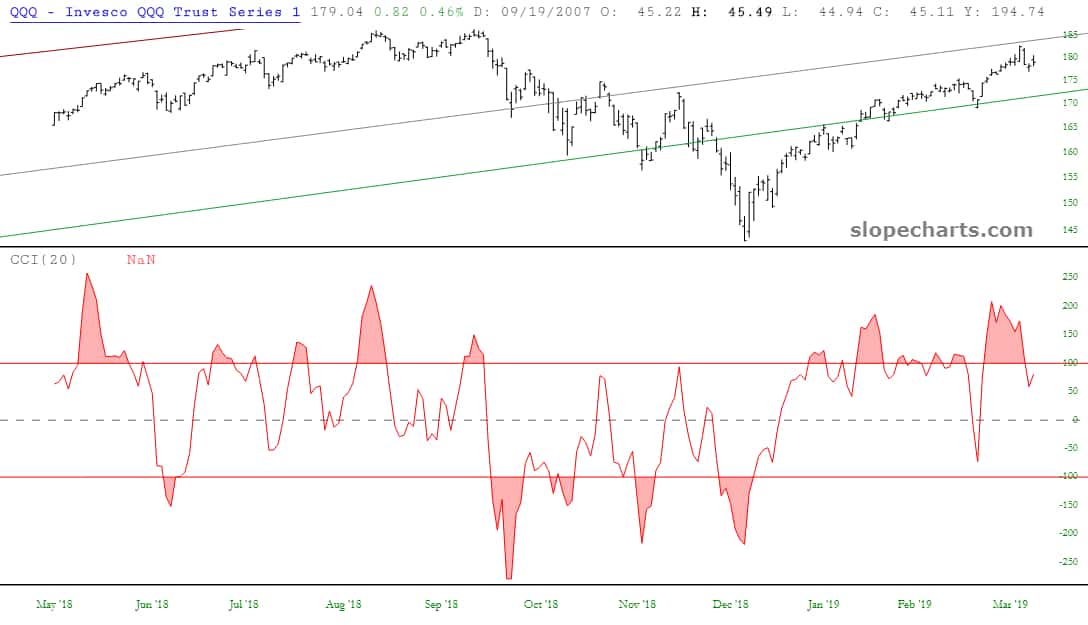
I’ve put down the Commodity Channel Index, and made it quite tall, to emphasize the change in course that the NASDAQ QQQ has been taking recently.
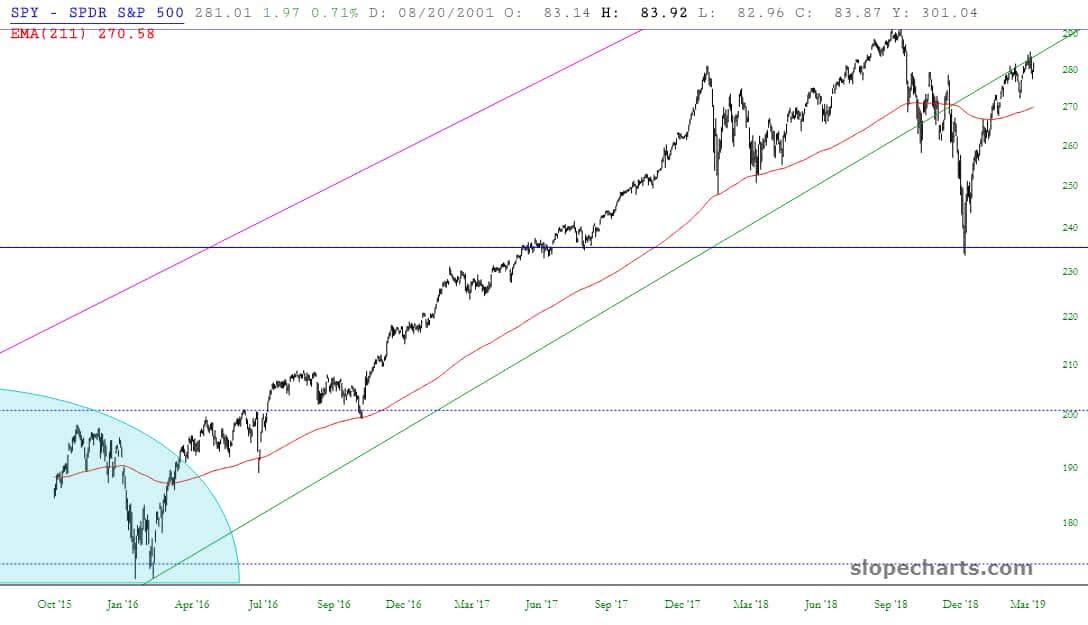
For the SPY, I used SlopeCharts’ dynamic moving average slider to show a long-term moving average which seems to do a decent job of major support and resistance levels. We are well above it now, and it would take a forceful move to shove it back into the bear zone.
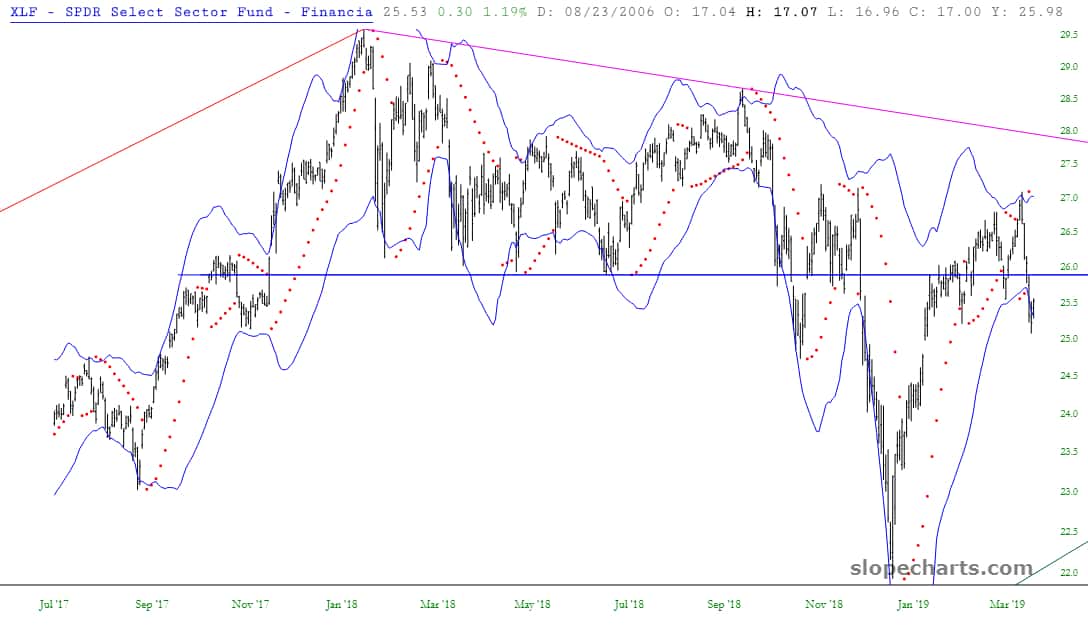
Besides KBE, above, we always want to look at XLF, below. Interestingly, the PSAR just flipped bearish on this one.
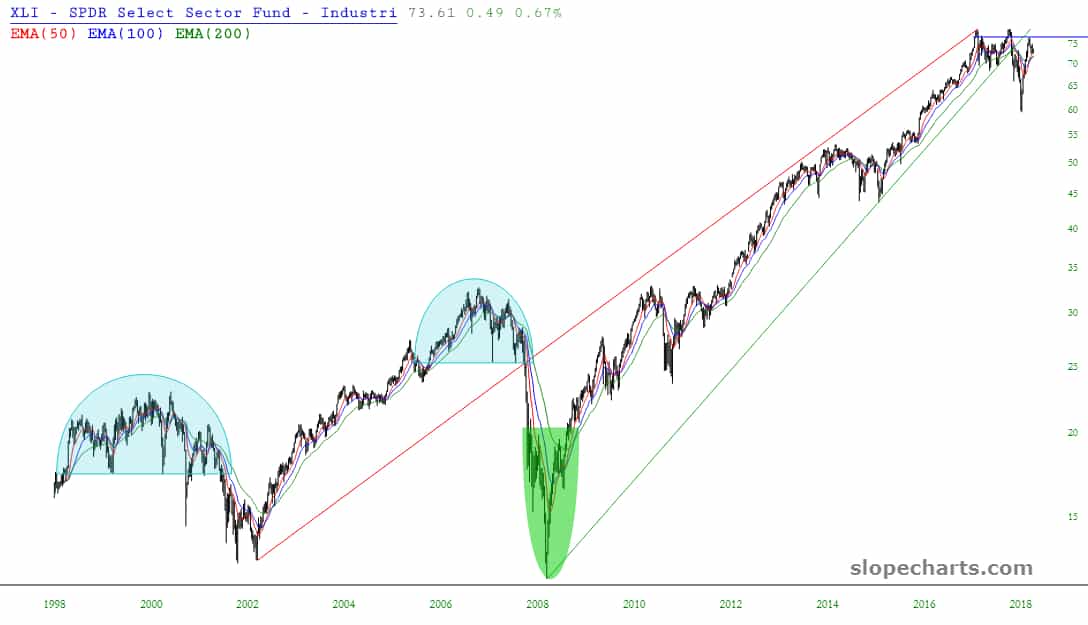
I’ve provided a longer-term view of the industrials XLI. Take particular note of its broken long-term uptrend and the lower high it made this quarter.
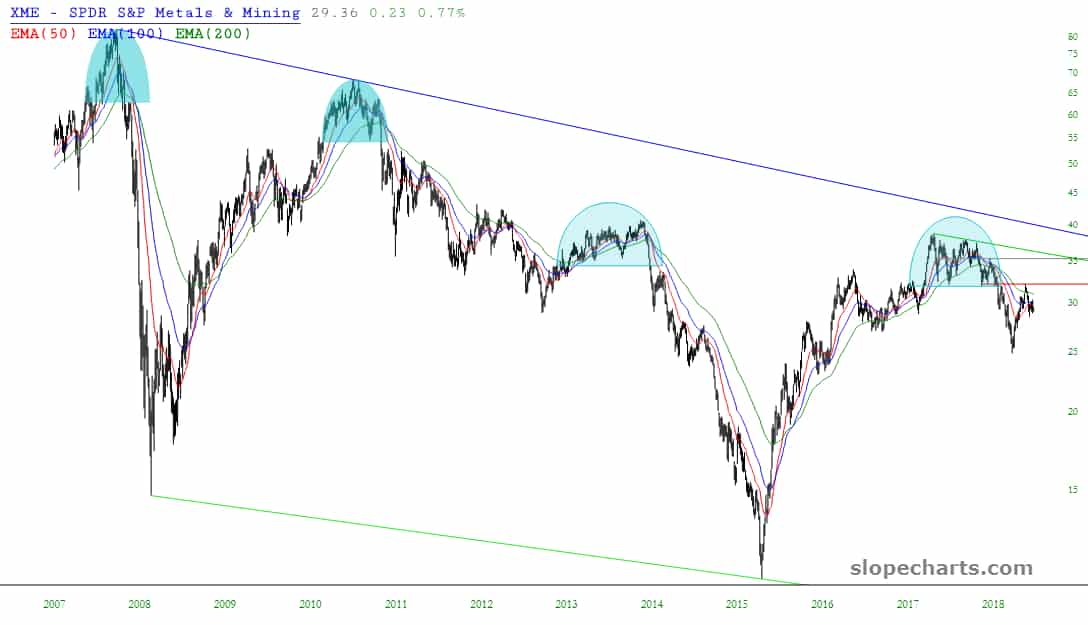
Lastly, our old friend the metals & mining fund symbol XME still seems well-poised for a long-term downtrend.