
The market just won’t shake itself loose, will it. For weeks now, it feels like we’ve been trapped. Unless you own one of the handful of mega-cap NASDAQ stocks that makes a lifetime high every single day, I suspect you have the same frustration that so many others do.
The source of this frustration can, I believe, be better understood with the equity index charts shown below. We begin with the Dow Jones Composite, which shares the same two fundamental features found on so many other big indexes and ETFs: (1) an important price gap, below which prices have traded for weeks (2) a broken trendline anchored to the March 23rd bottom.

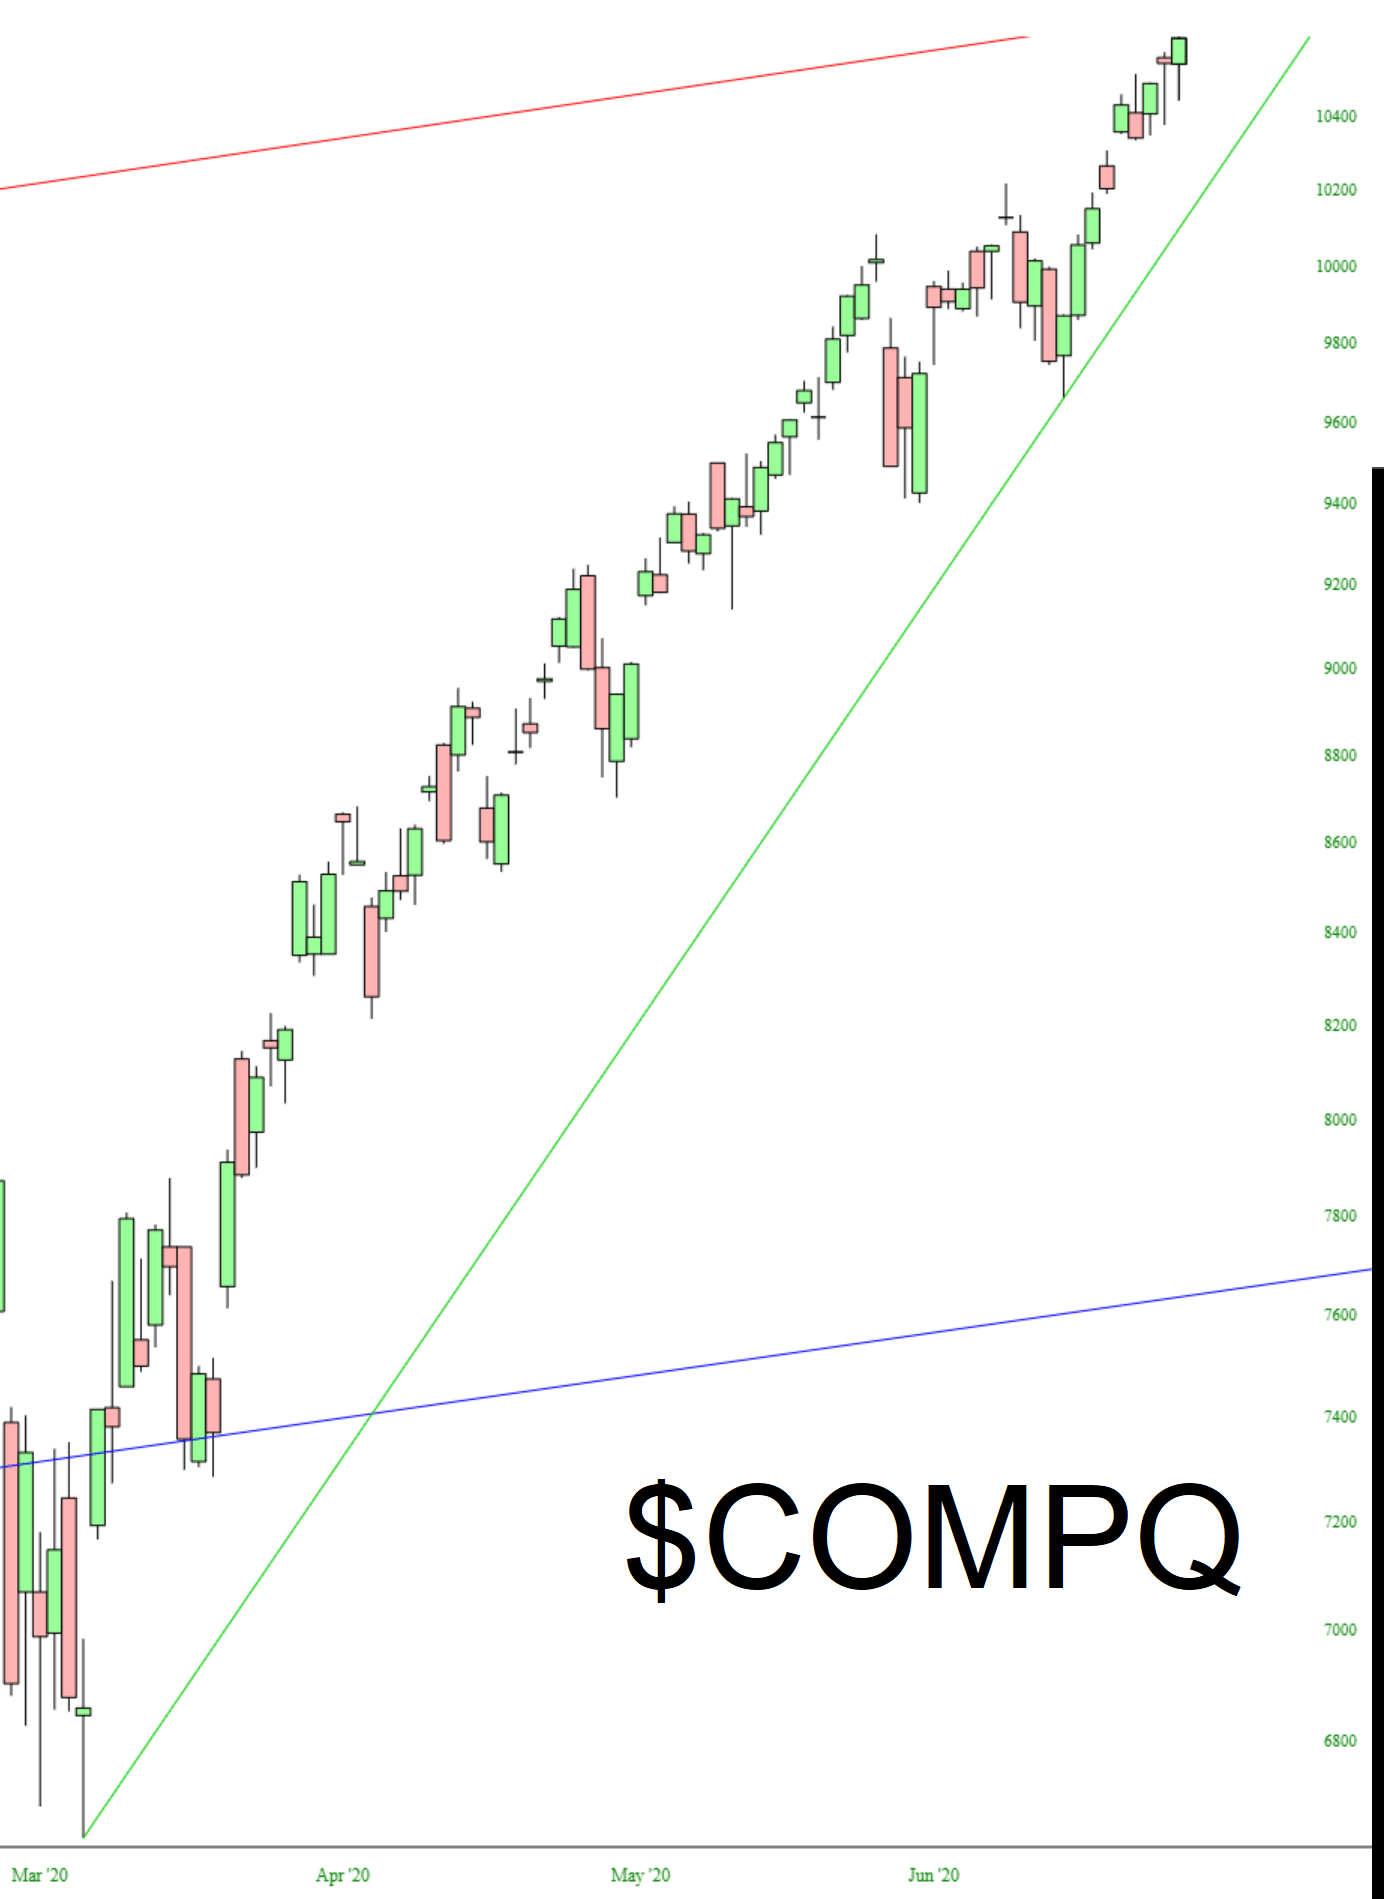
What is exceptional in this market is the NASDAQ Composite, which is up, up, up, and then up some more. It’s just jaw-dropping. Not a downtick to be seen. It occurred to me a few minutes ago that the same cash I put into my Tesla car would be worth $4 million in TSLA stock now.
The Dow 30, not surprisingly, is very similar to the Composite. The island reversal is squeaky-clean, and we’re on the bearish side of the trendline now (although God knows it doesn’t feel like it).

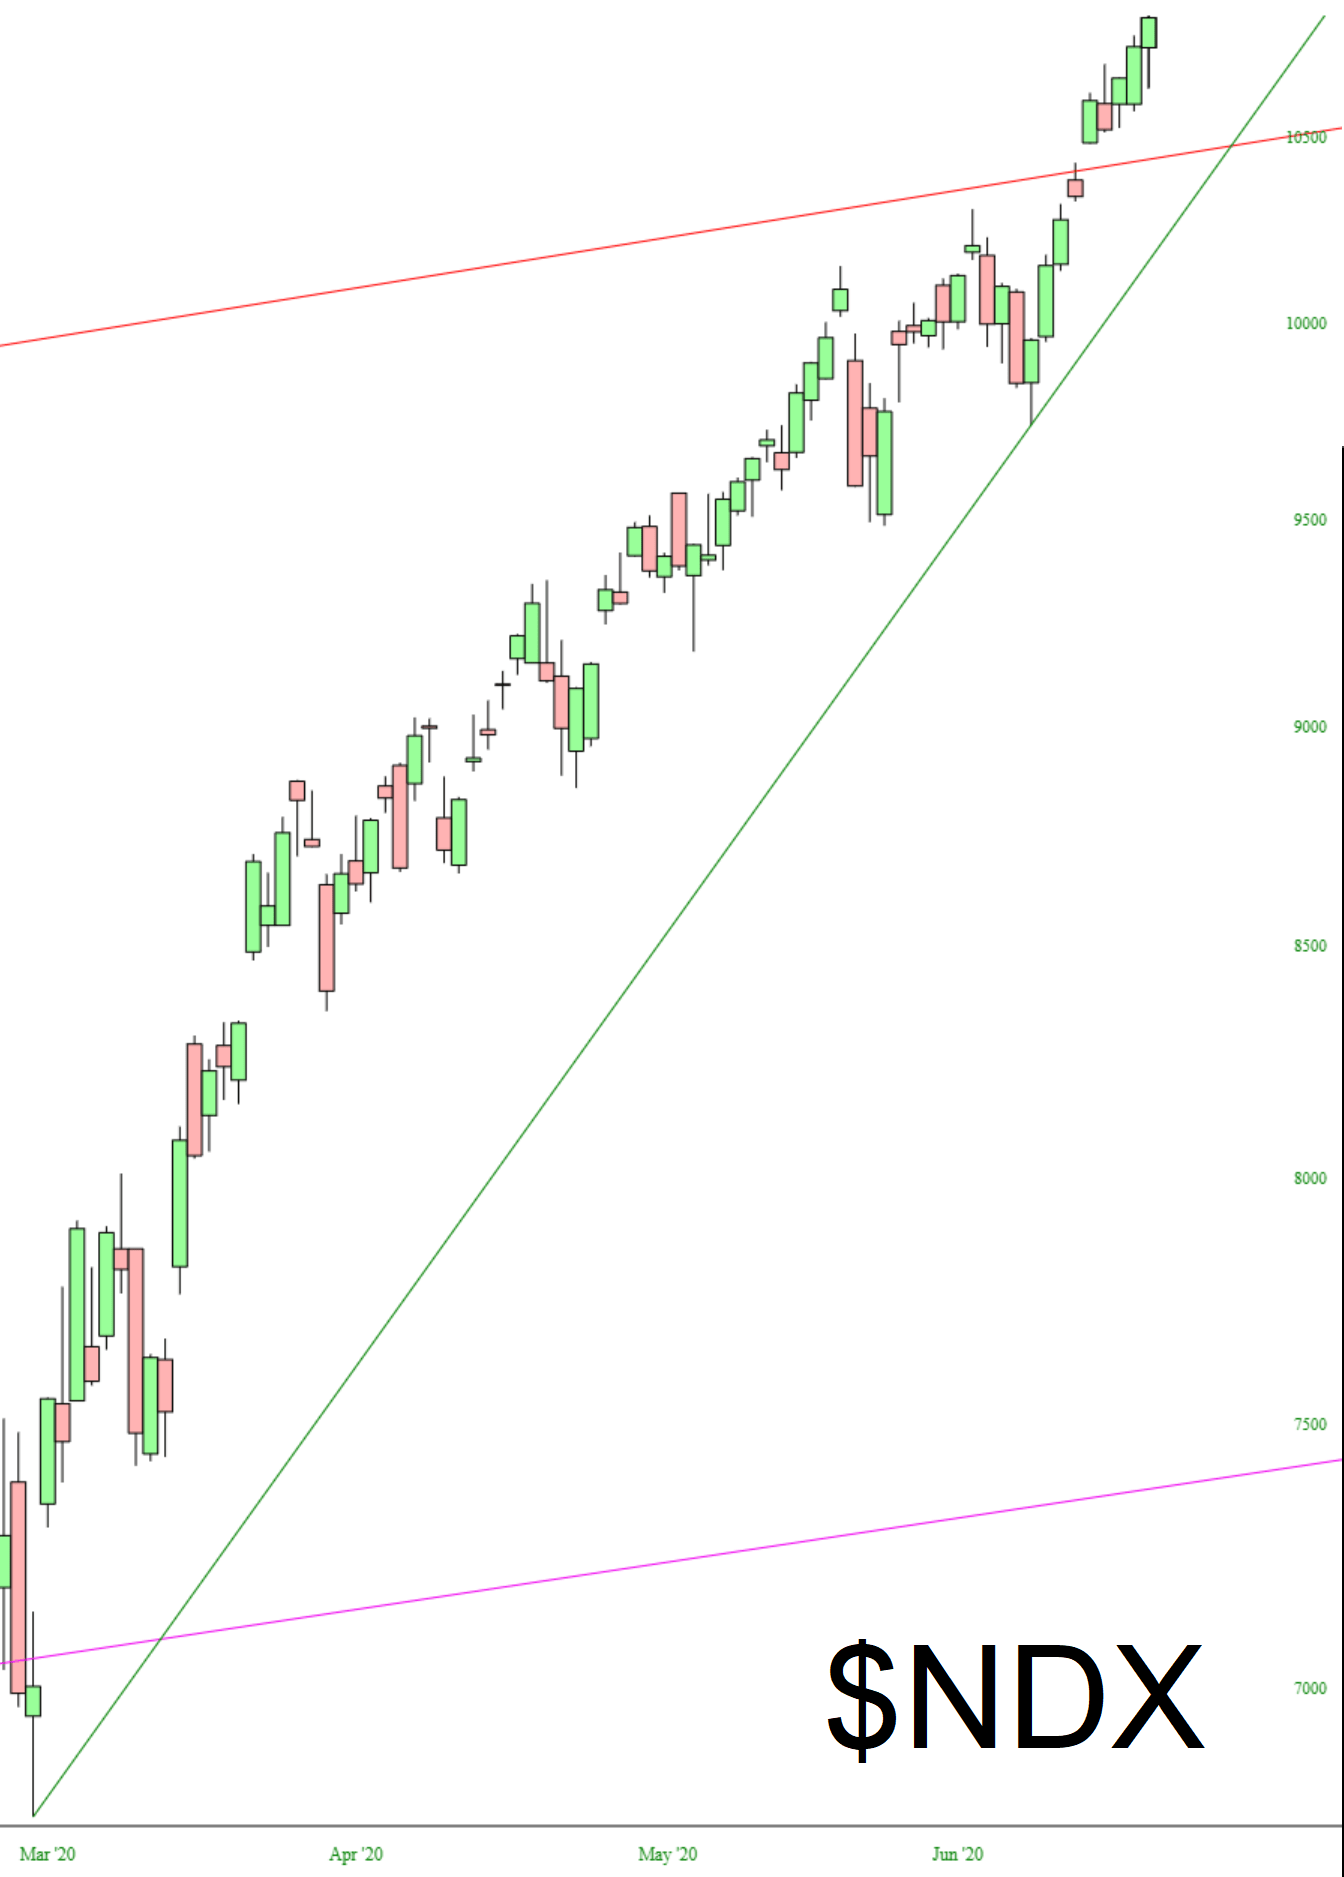
Flipping back to tech-land, we can see the NASDAQ 100 is an even more extreme version that the Composite was. March 2000 called and wants its chart back.
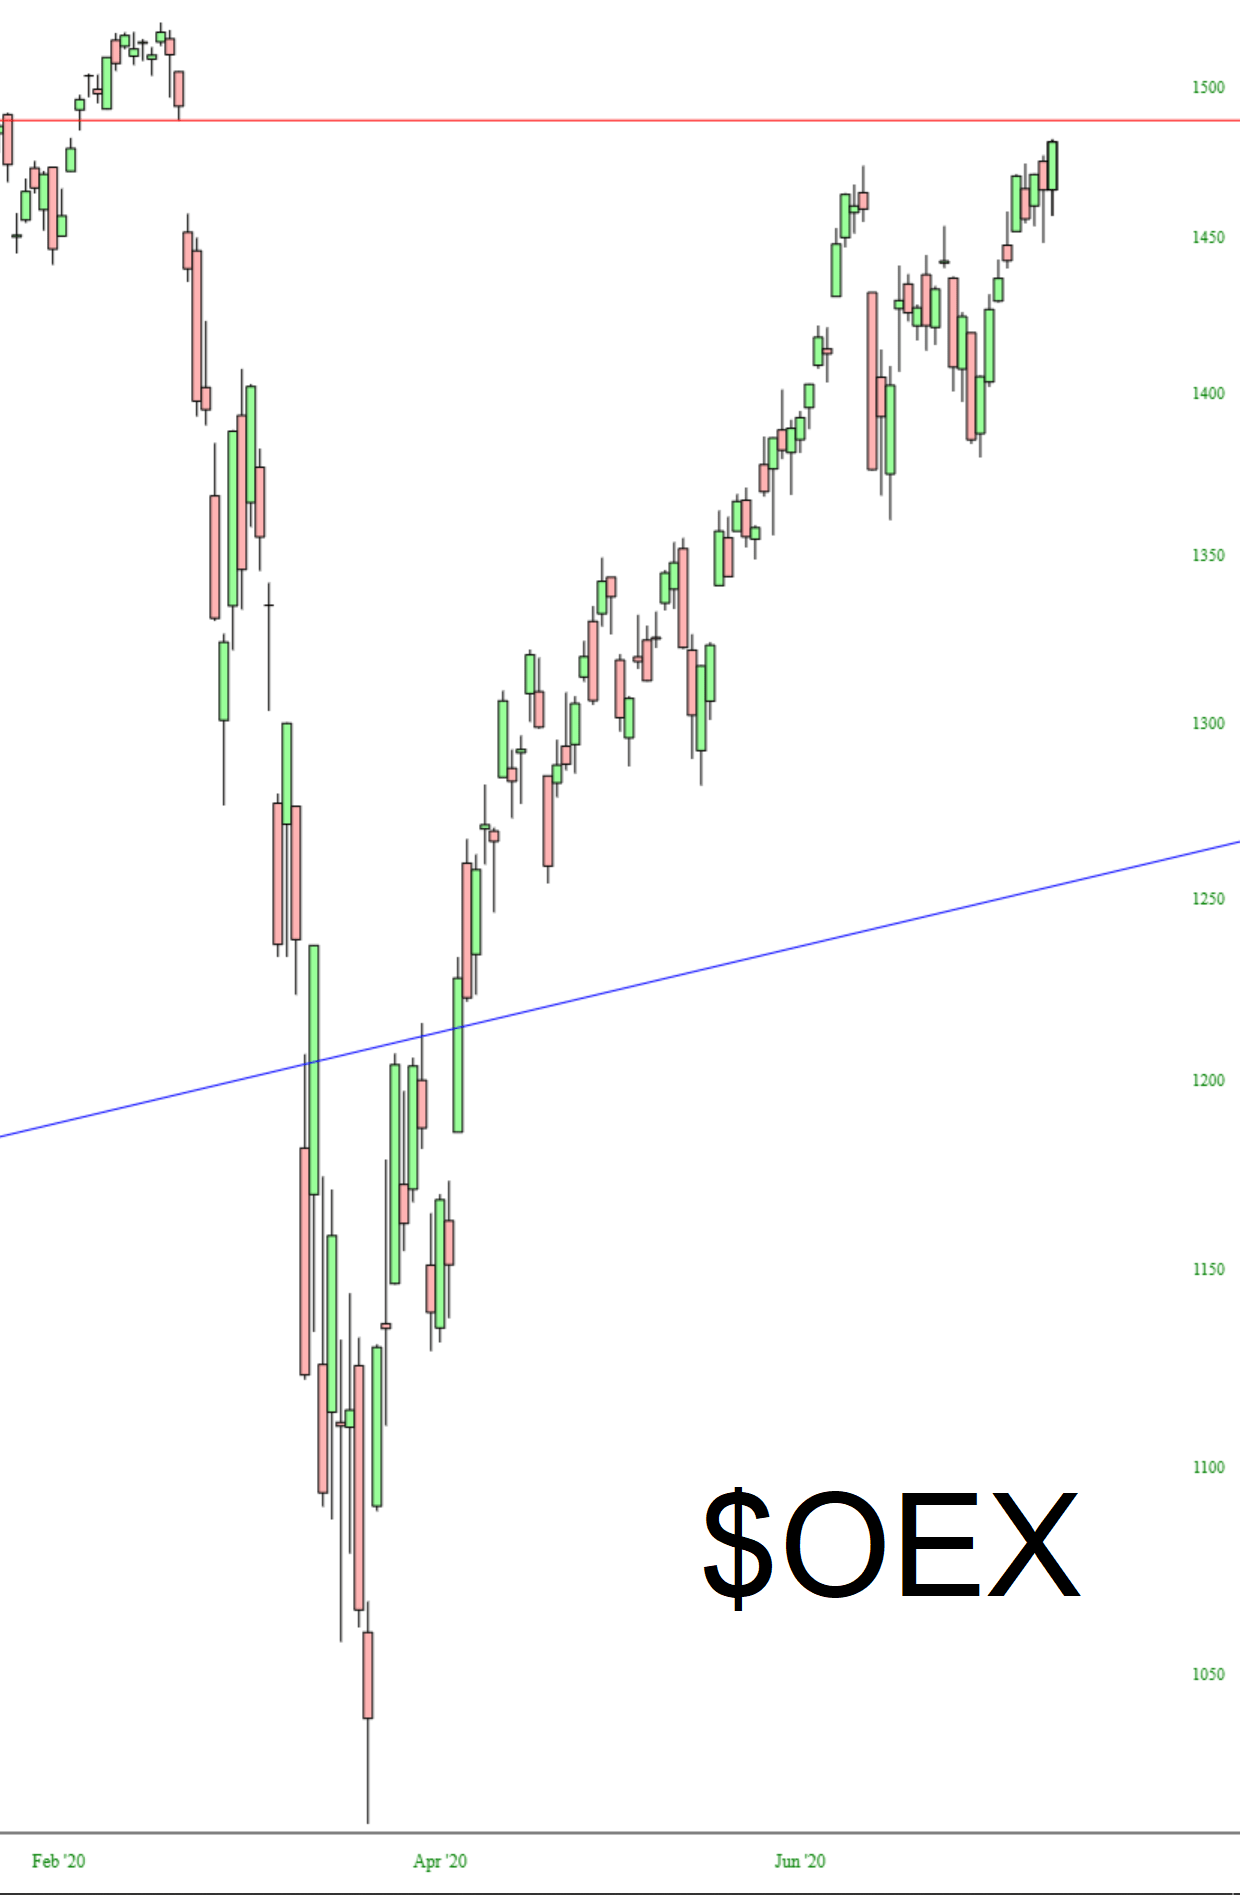
Here is the S&P 100, with the same unadulterated price gap.
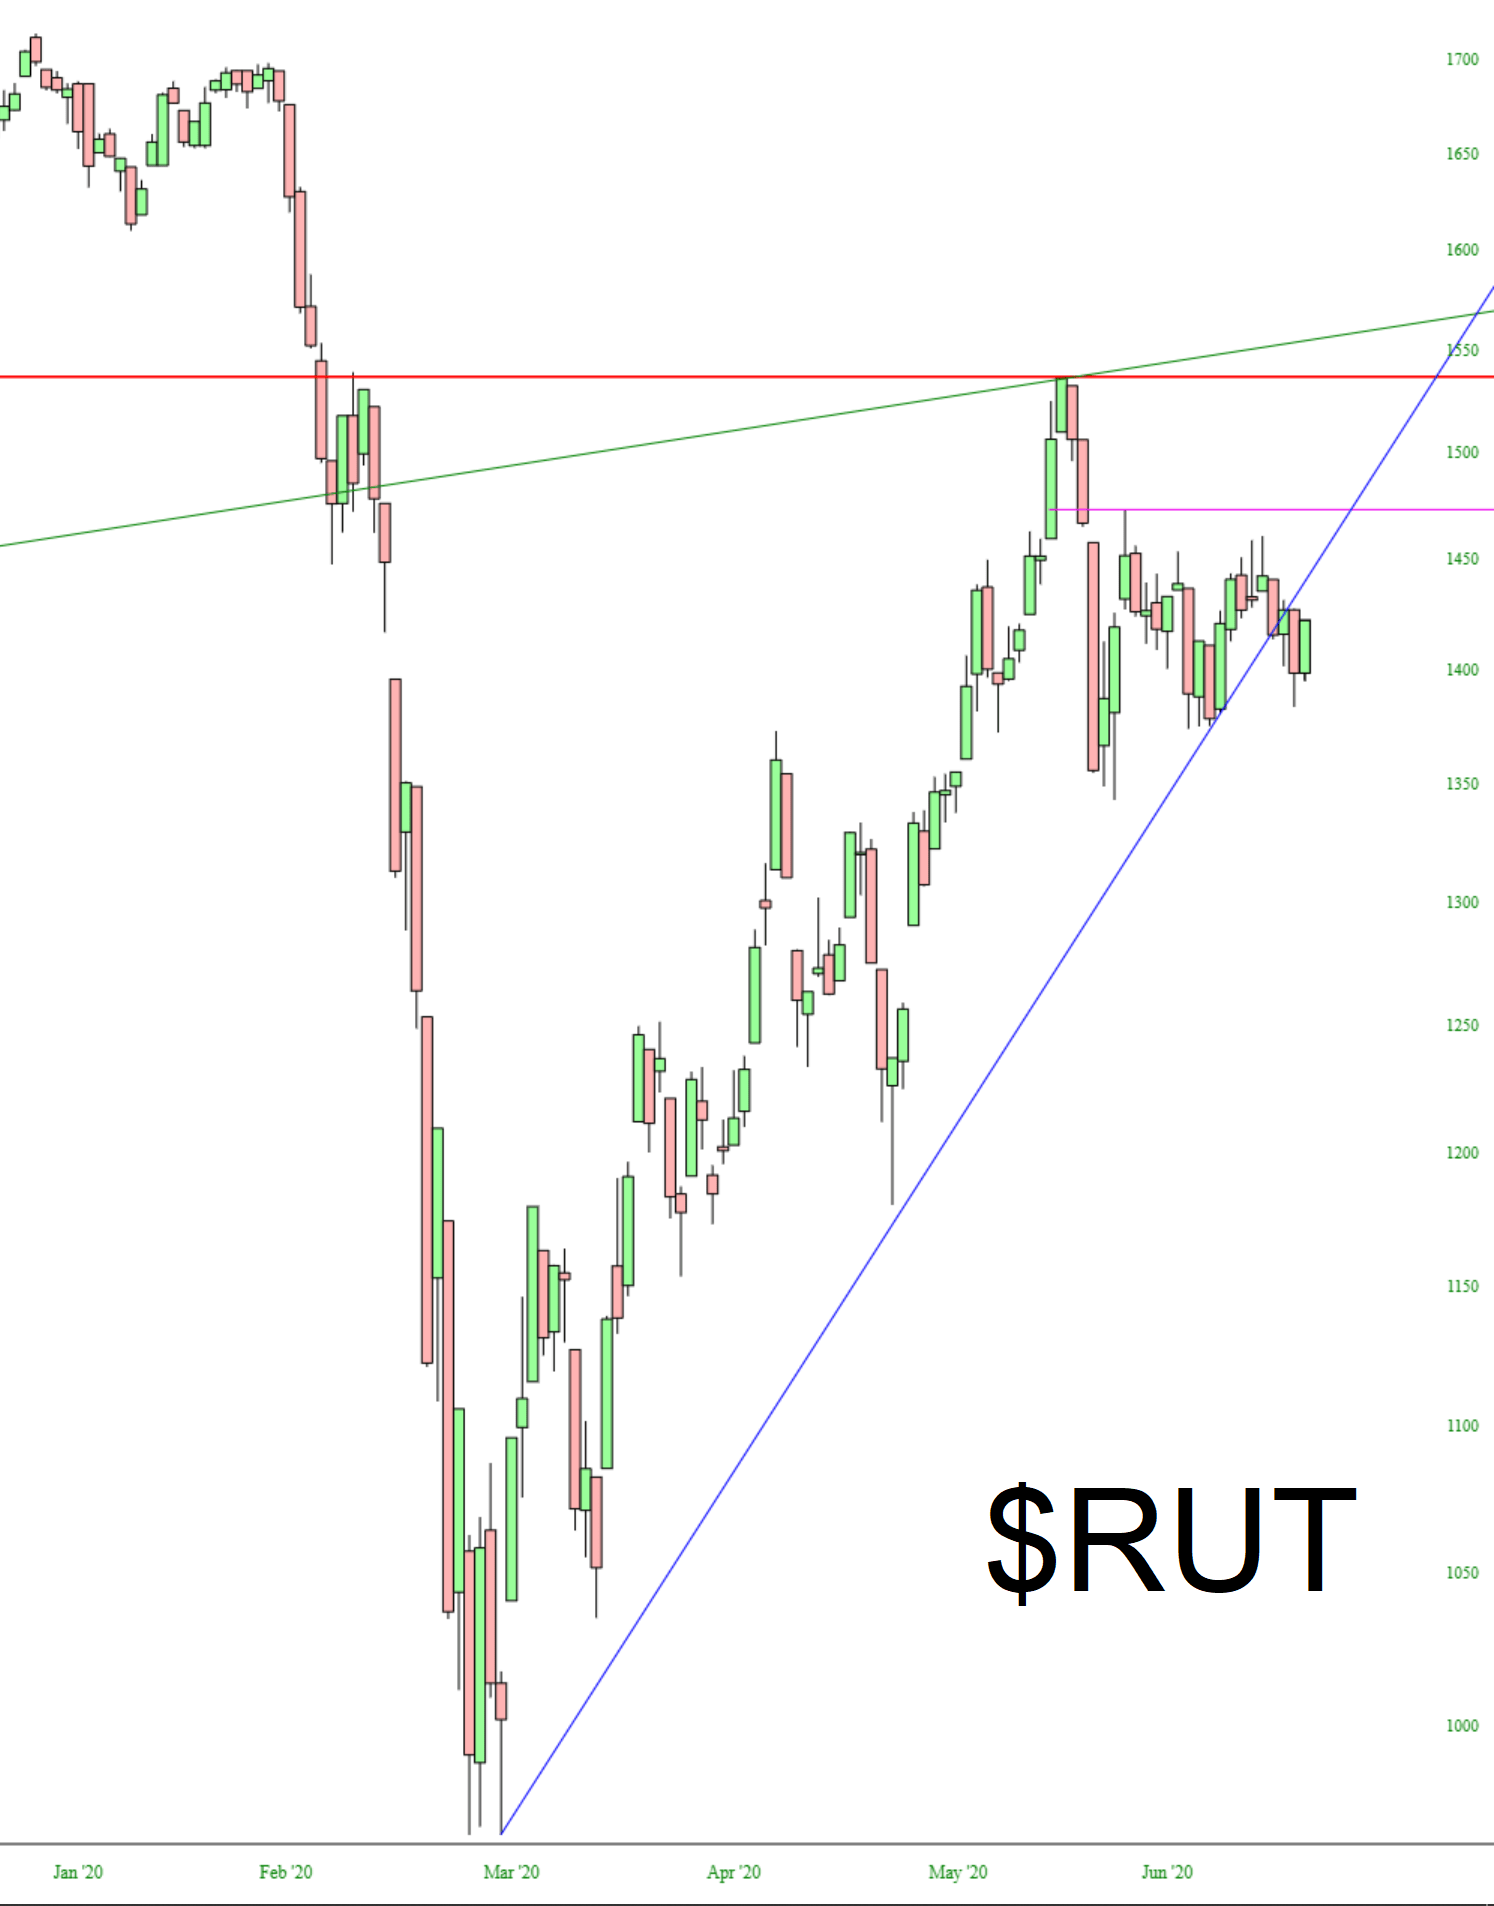
The Russell 2000 is what I watch more closely than any other. If the small caps are down 1%, my portfolio is typically up 3%. Sadly, the converse is also true. Thursday of this past week was terrific. Friday took care of that promptly. I’m glad to note, however, that at least the trendline was finally busted.
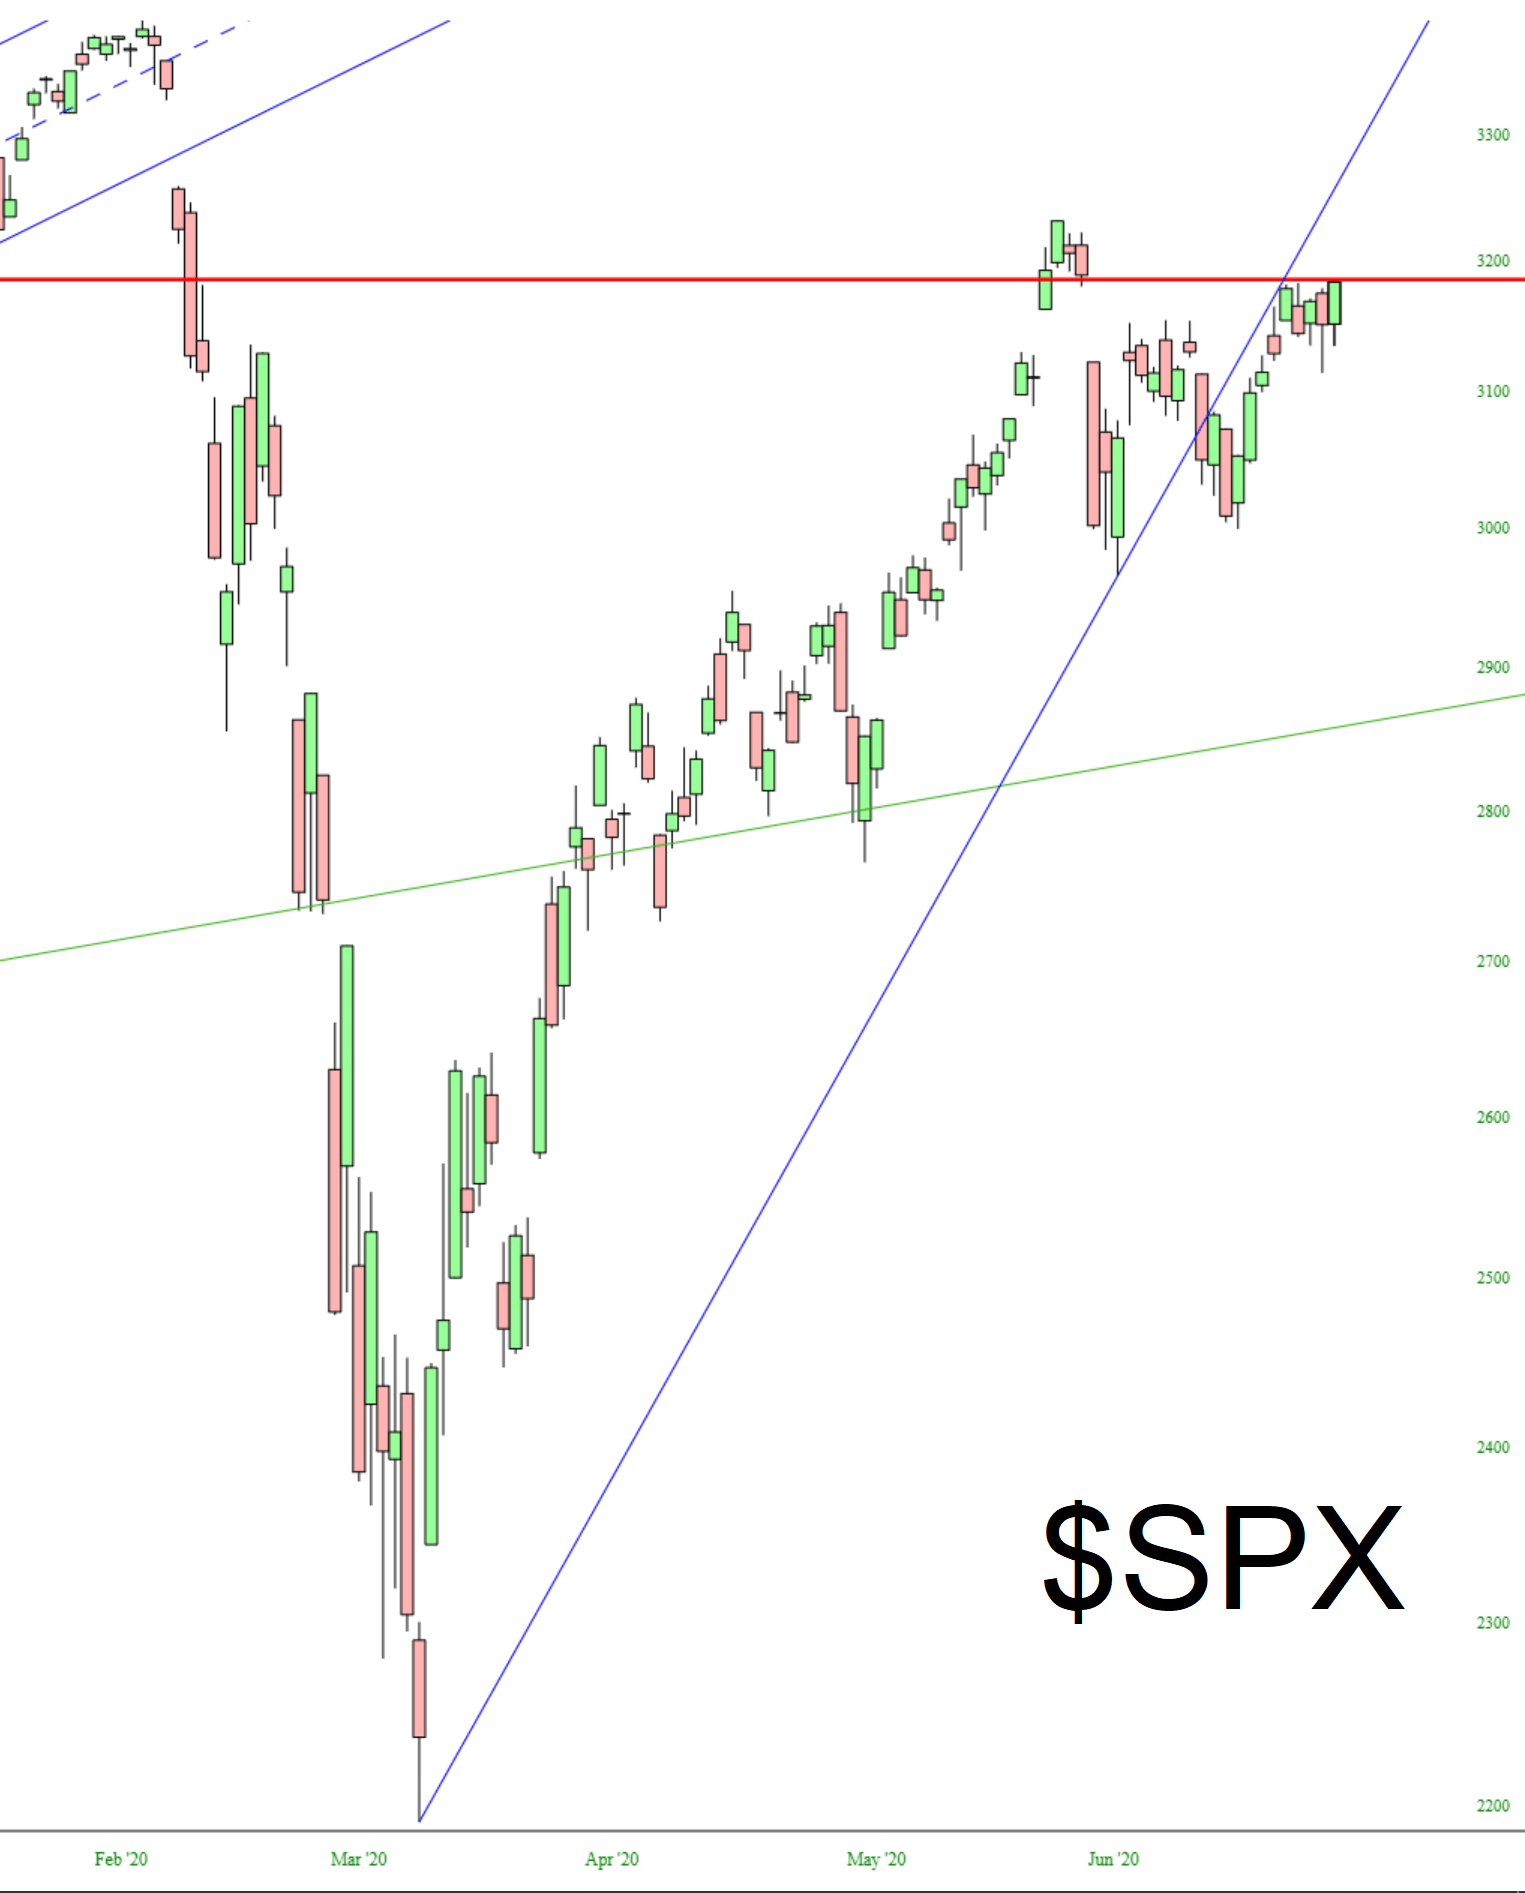
The S&P 500 sealed up its price gap beautifully, and it remains on the broken underside of its own intermediate-term trendline.
Of course, the Transportation index has suffered particularly mightily with the pandemic, and the Himalayan mountain range of overhead supply will not easily be conquered for years.

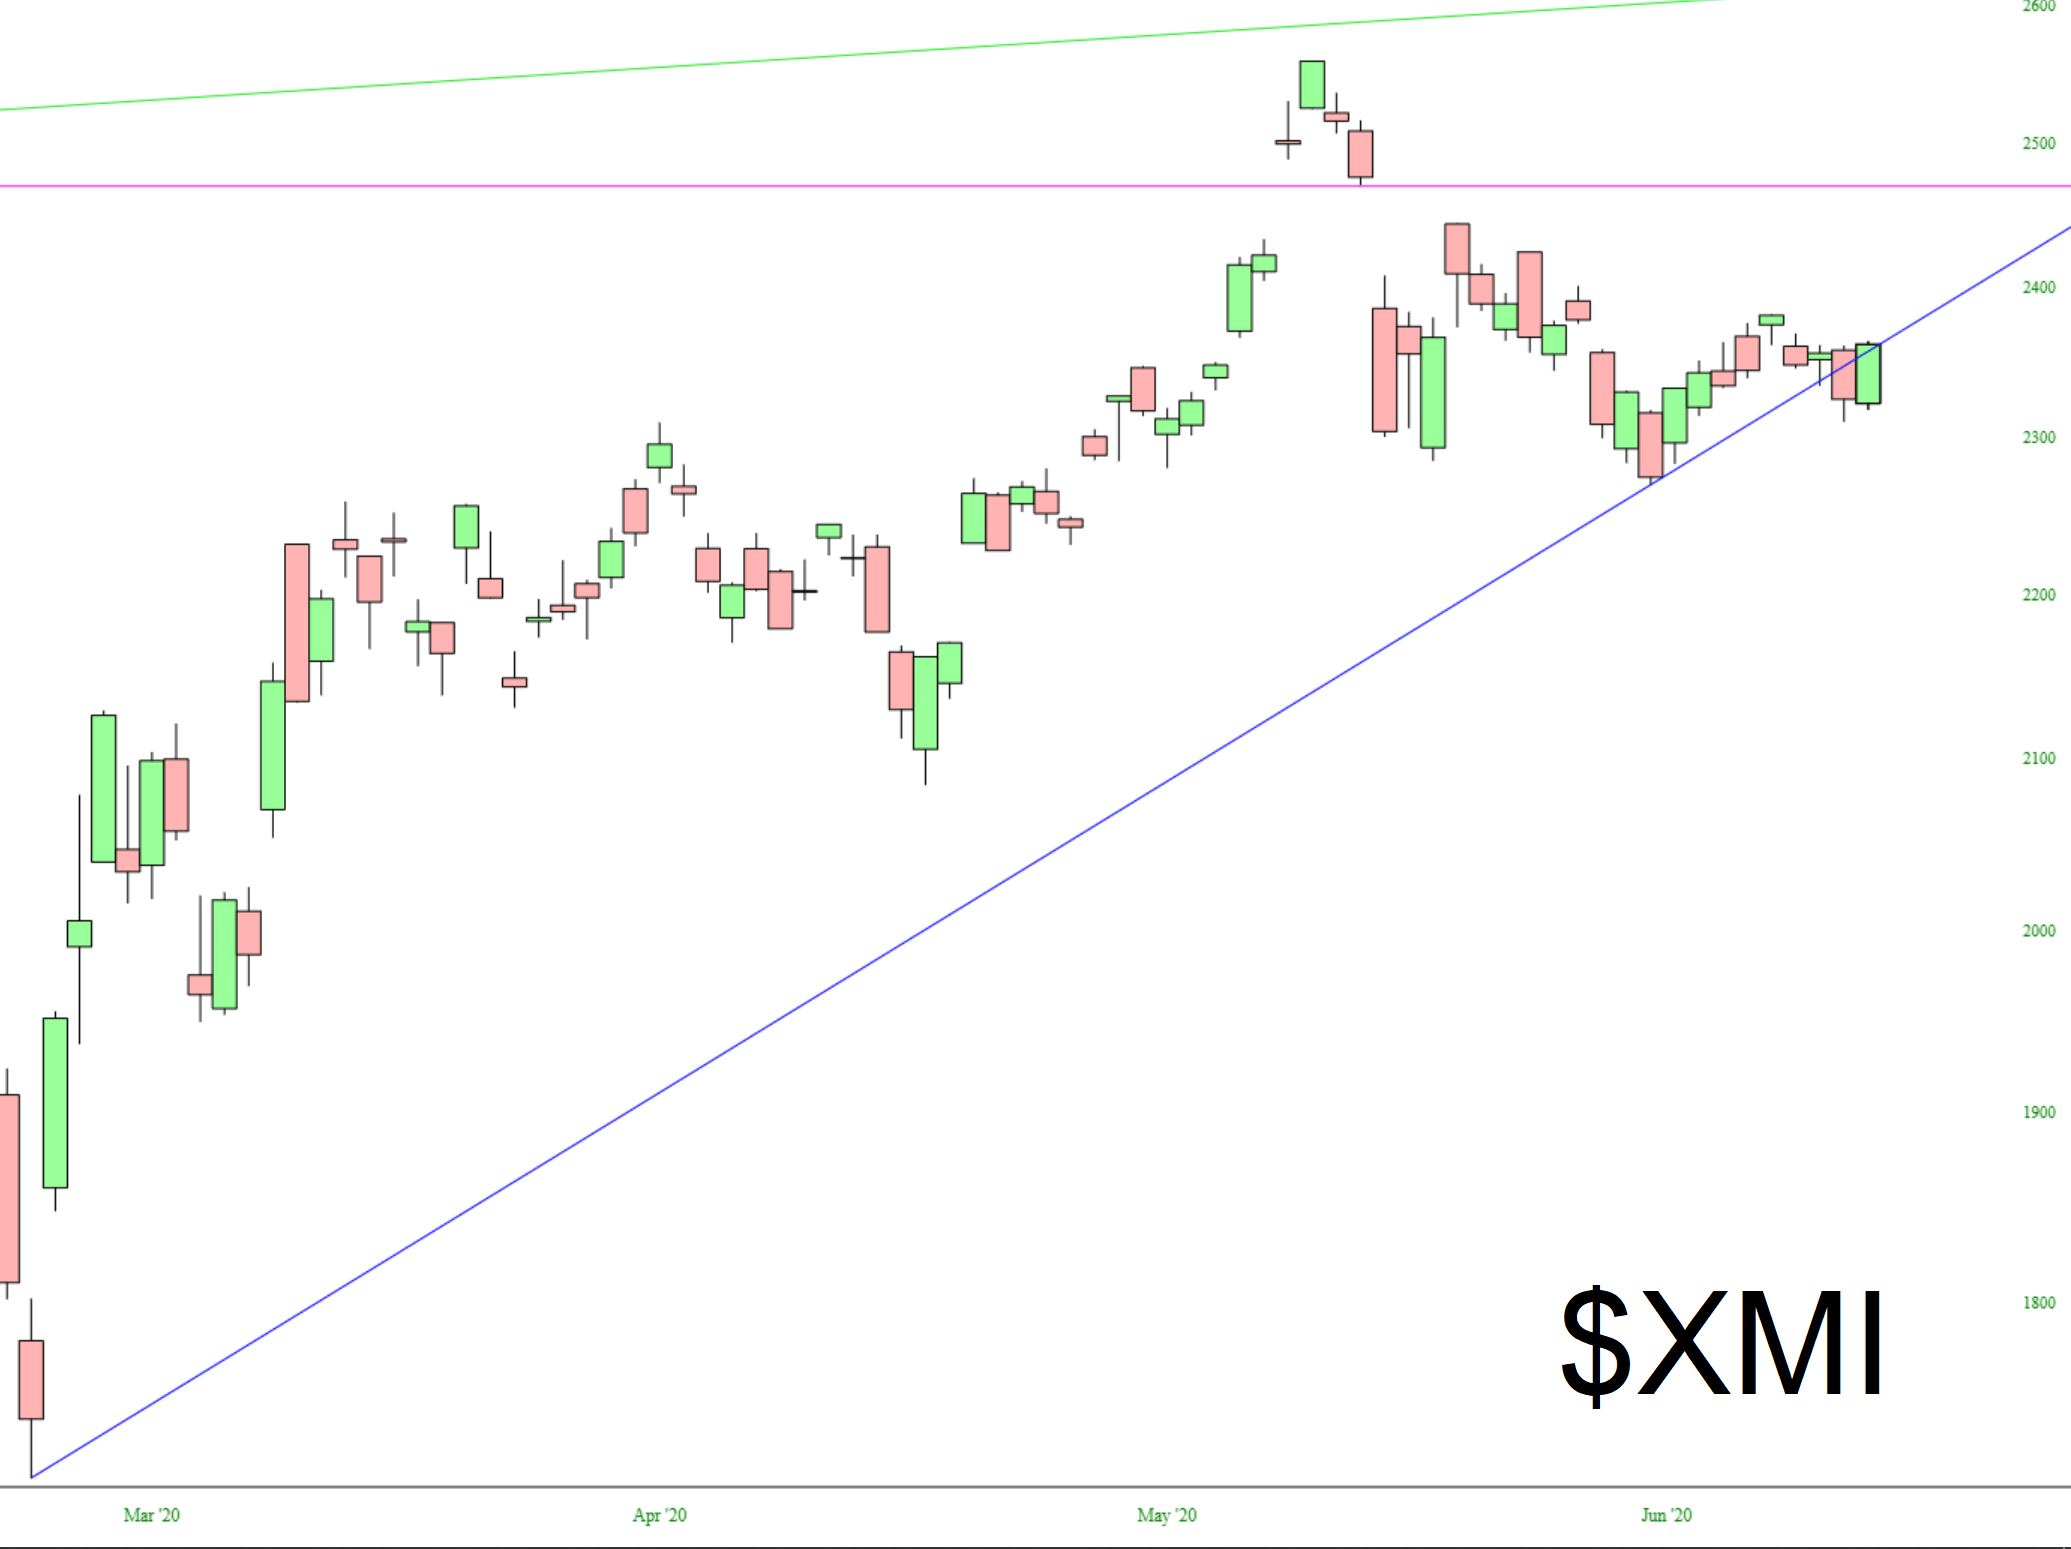
Lastly is the Major Market Index which, like the Russell, sneaked oh-so-subtly beneath its trendline, finally breaking it.
My portfolio management lately has been anchored to the simple notion of a complete intolerance of losses. At Friday’s close, I had 57 short positions, all of them in the green (no mean feat, considered what the NASDAQ has been doing). My commitment level is 138%, and for the first time in months, I’ve bought some put options: QQQ and IWM, both of them expiring way out on October 16th of this year.
