I don’t think there’s been any more “in demand” feature with respect to SlopeCharts than cycle tools. I am pleased to introduce the first one today: Cycle Lines.
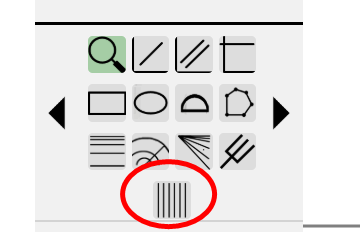
The Cycle Lines tool is accessible by clicking on the icon in the drawing tools palette:
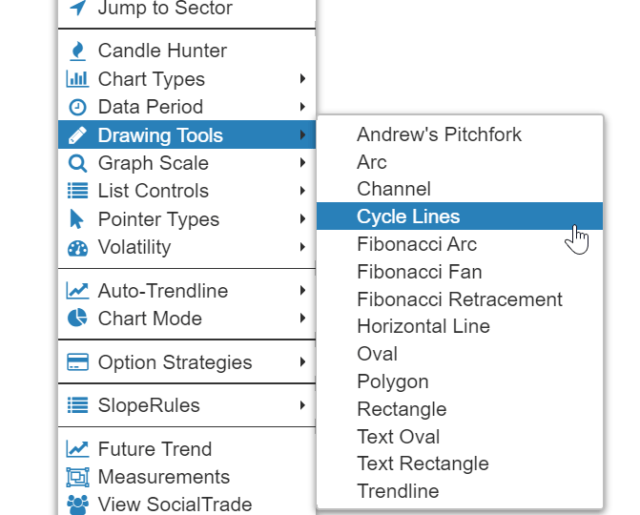
Or, alternately, by choosing it from the Drawing Tools sub-menu when right-clicking inside SlopeCharts:
Using the tool is very easy, since you just need two anchor points. Click the first anchor point wherever you want the first vertical line drawn, and click the second anchor point when you have the width you want. As with all drawn objects, you can move either of these anchor points after you have established the drawn object, so it’s OK to “rough out” where you want it to go before fine-tuning it (or getting rid of it altogether if it turns out to not be helpful).
Here, for example, is the long-term continuous gold futures contract. The vertical lines are evenly spaced, and as can be seen, each line marks what appears to be a powerful inflection point at the same rate of periodicity.
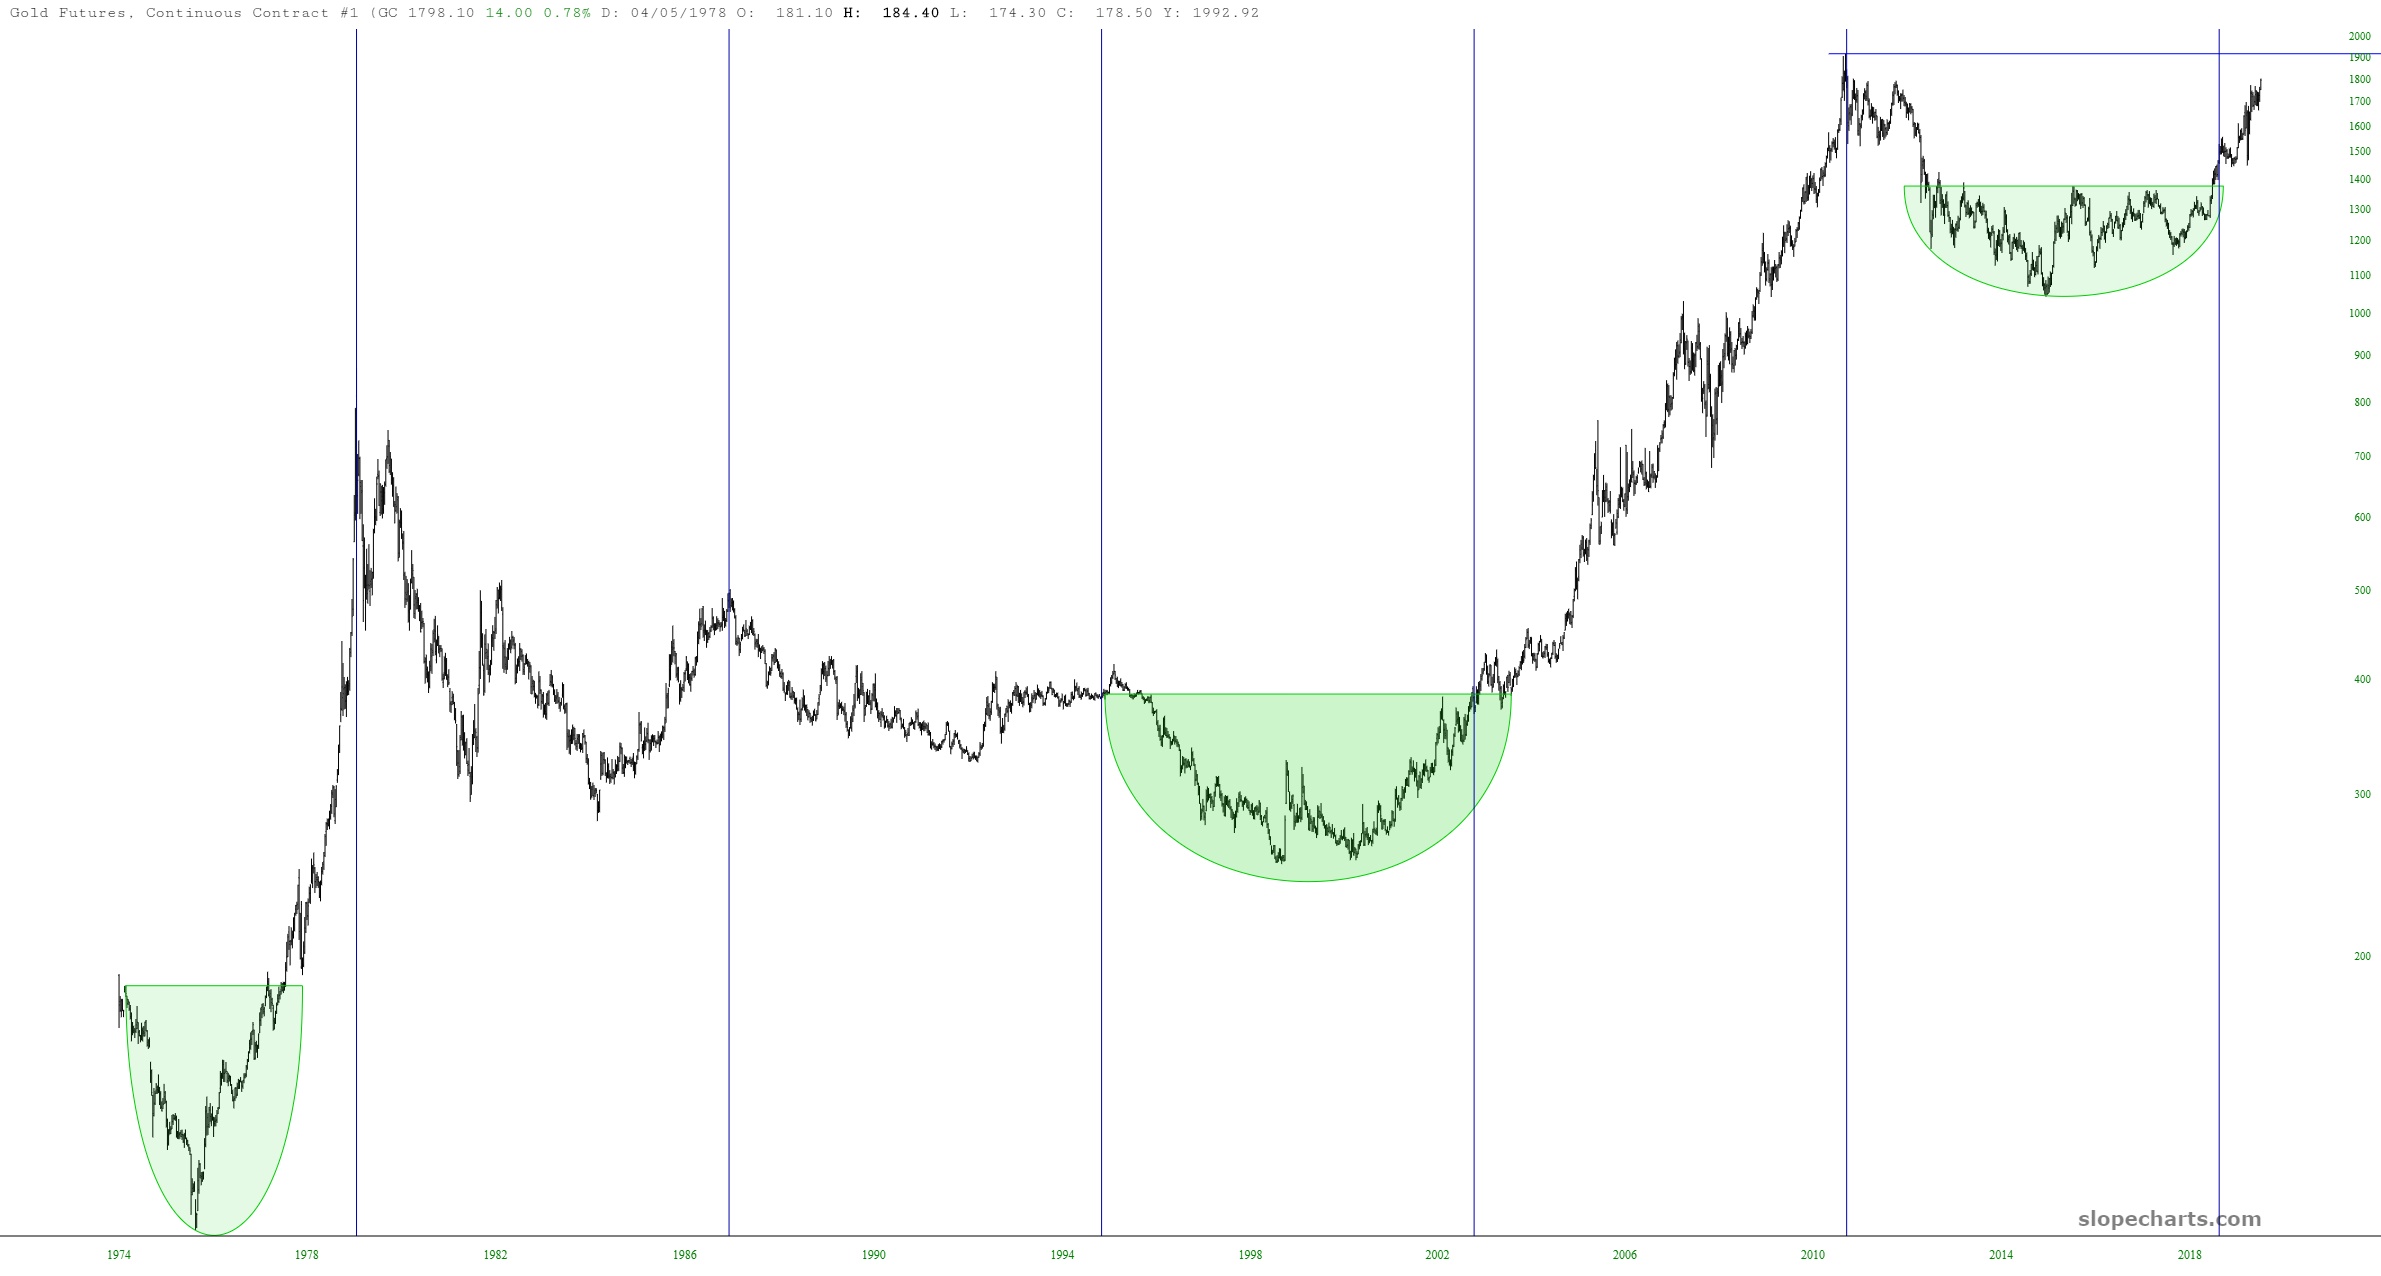
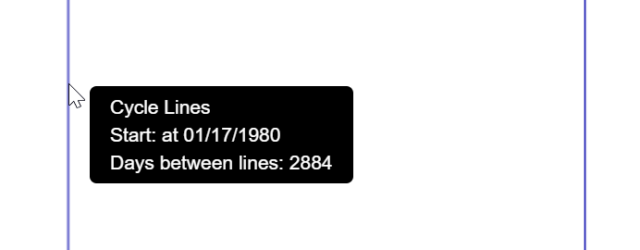
By pointing to a Cycle Line object, you can see the precise date where it begins and how many days separate each line.
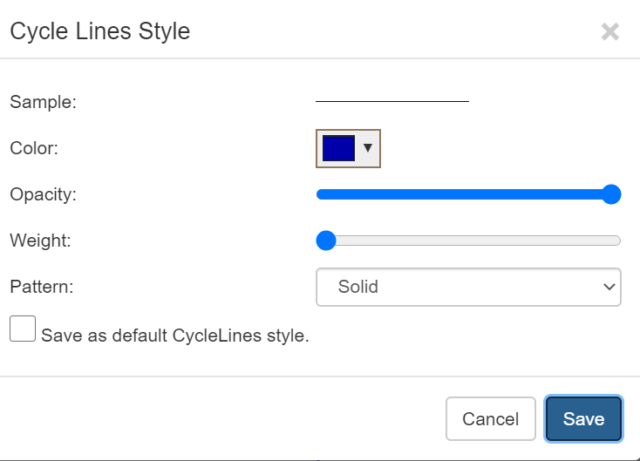
You can also right-click the drawn object and choose Change Style to access the style dialog box. Here you can alter the color, opacity, weight, and pattern of the line, as well as establish if you’d like your settings to be used as the default for future cycle line studies.