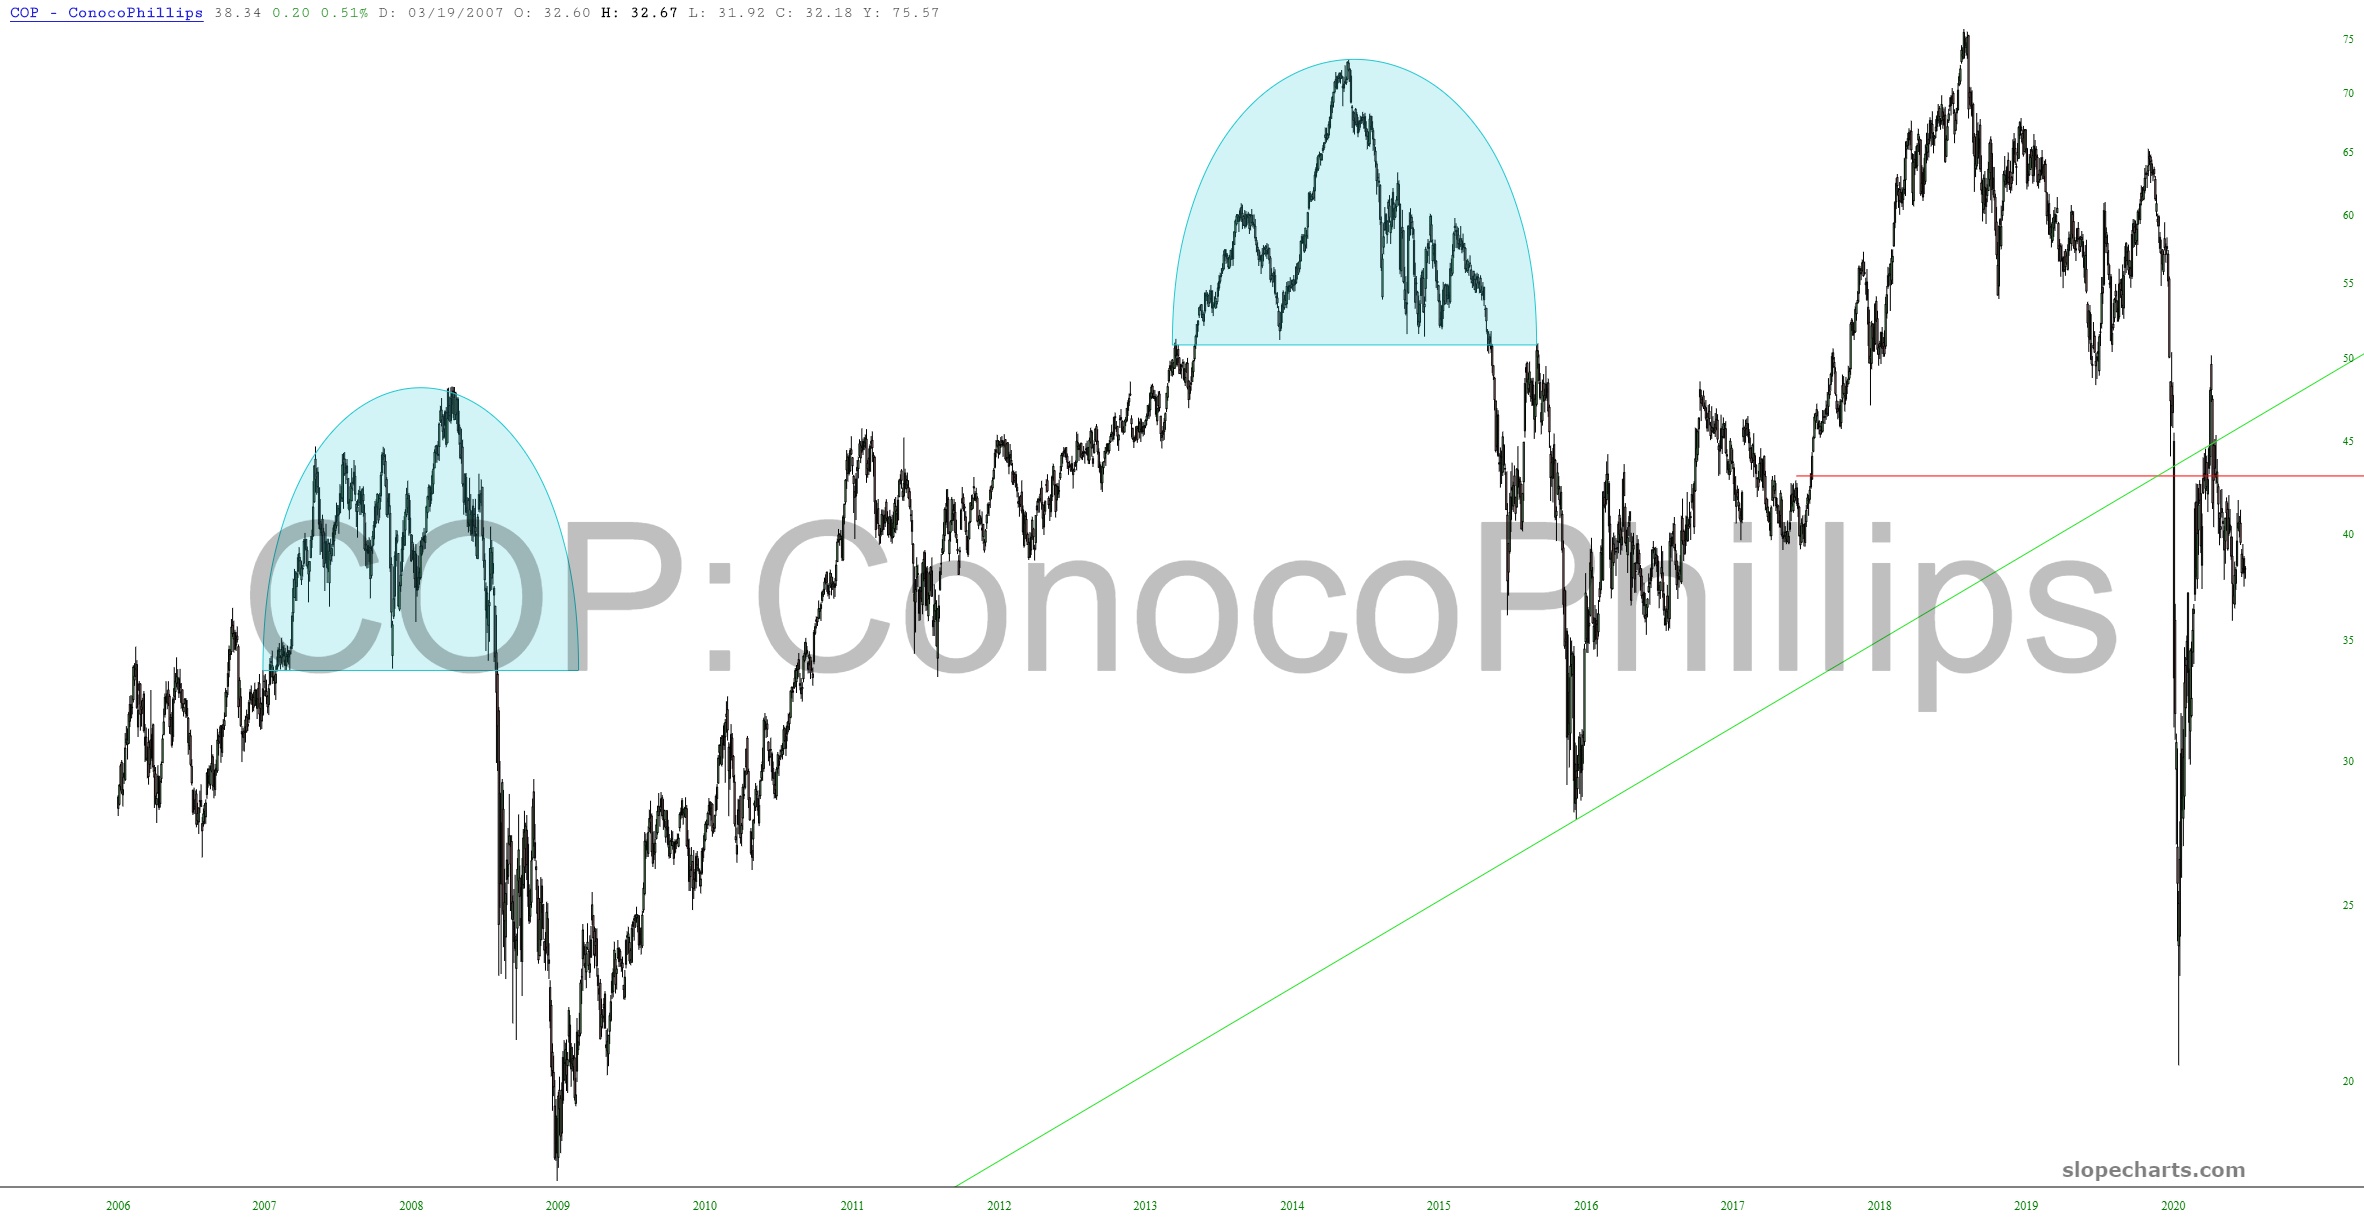
Preface to all three parts: I have, understandably, a fairly light portfolio of shorts at this point. I have broken my 39 positions into three equal portions. Here is one-third of them:
Slope initially began as a blog, so this is where most of the website’s content resides. Here we have tens of thousands of posts dating back over a decade. These are listed in reverse chronological order. Click on any category icon below to see posts tagged with that particular subject, or click on a word in the category cloud on the right side of the screen for more specific choices.
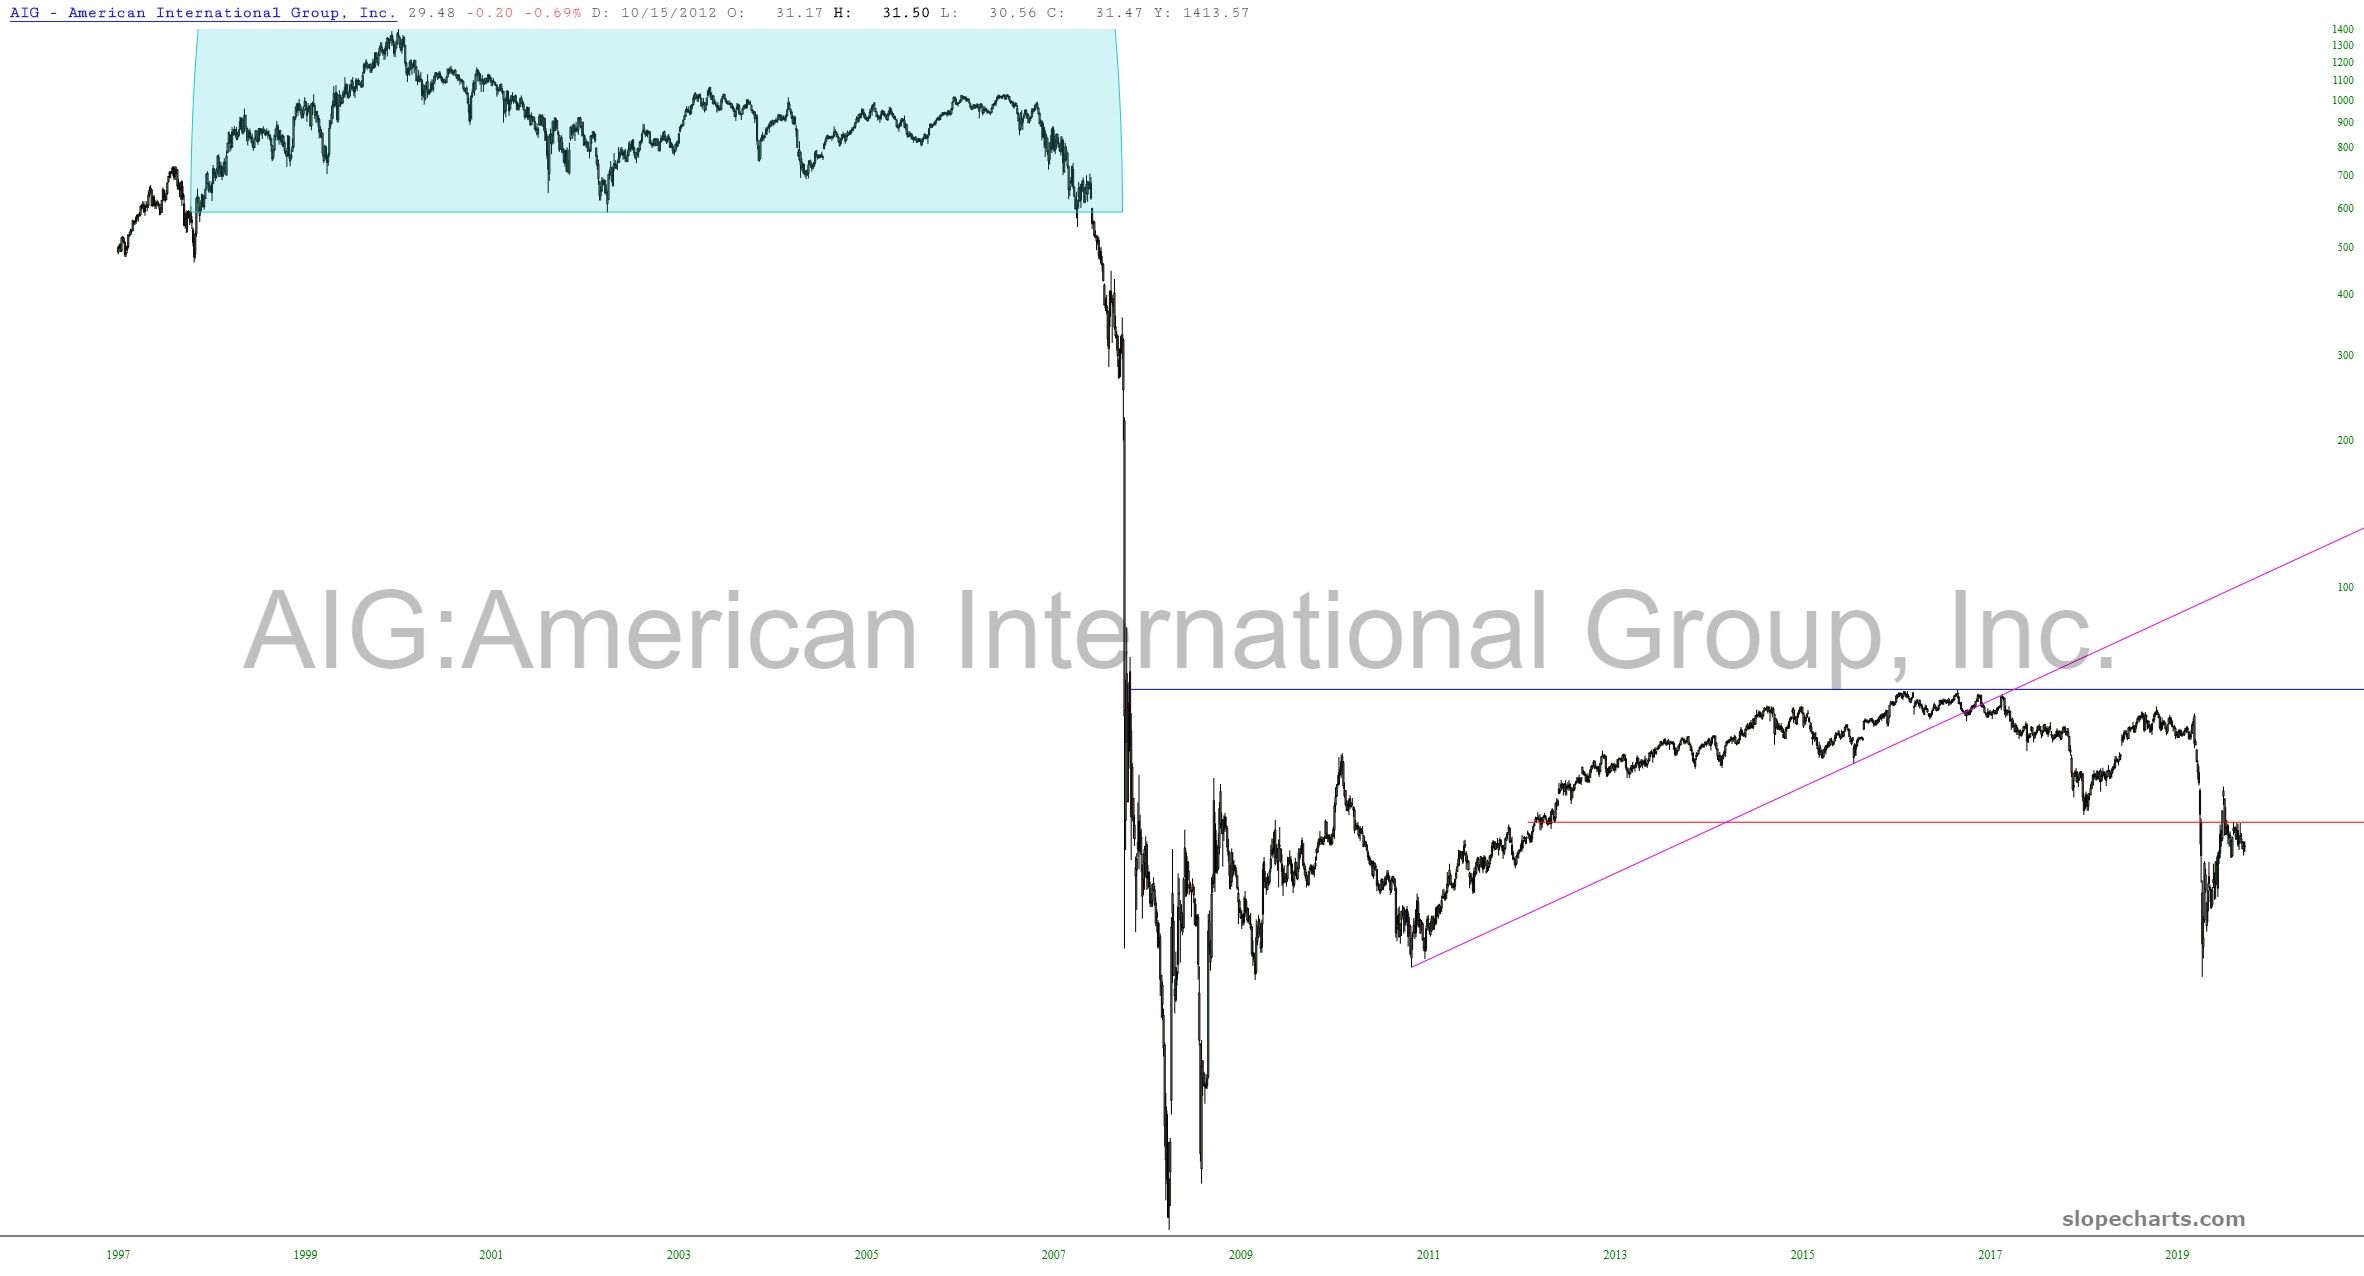
Preface to all three parts: I have, understandably, a fairly light portfolio of shorts at this point. I have broken my 39 positions into three equal portions. Here is one-third of them:
Anne Scheiber worked as an auditor for the IRS. She retired at the age of 51 in 1944, and focused on managing her portfolio for the next 51 years of her life.
I wanted to share with you the story of Anne Scheiber, who died at the age of 101 with a portfolio of dividend stocks worth over $22 million. That portfolio was generating over $750,000 in annual dividend income at the time of her death. Anne Scheiber is one of the most successful dividend investors of all time.
I believe that this story can be inspirational to many. After reviewing it, I can tell you that I understand the blueprint for financial success. One can easily see the steps taken to achieve financial independence, so that they can mold their lifestyle in a way, shape or form that they desire.
(more…)Preface to all three parts: I have, understandably, a fairly light portfolio of shorts at this point. I have broken my 39 positions into three equal portions. Here is one-third of them:
SPX has gone through a lot of trendlines and divergence on this amazing move up, with the last lot breaking on the move over the 3350 area including the negative divergence on the daily RSI.
SPX is very stretched here, has punched 100 handles over the monthly upper band, touched an amazing 7.1% above the 45dma when I last annotated that chart yesterday, and is now close to testing the last and largest resistance trendline on the chart.
That trendline starts at the March 2009 low, held support at the 2010 low, and then was touched as resistance at highs in 2011, 2012, 2014, 2017/8, 2020 and is now close to being tested as resistance again. That trendline hasn’t broken as resistance since SPX crossed below it in 2011, and I have it in the 3510-20 area at the moment, though that is an approximation on a trendline that is now more than eleven years old. At the time of writing SPX has reached a new all time high at 3508.07.
(more…)