Gartman 2.0 does it once again……….

Slope initially began as a blog, so this is where most of the website’s content resides. Here we have tens of thousands of posts dating back over a decade. These are listed in reverse chronological order. Click on any category icon below to see posts tagged with that particular subject, or click on a word in the category cloud on the right side of the screen for more specific choices.
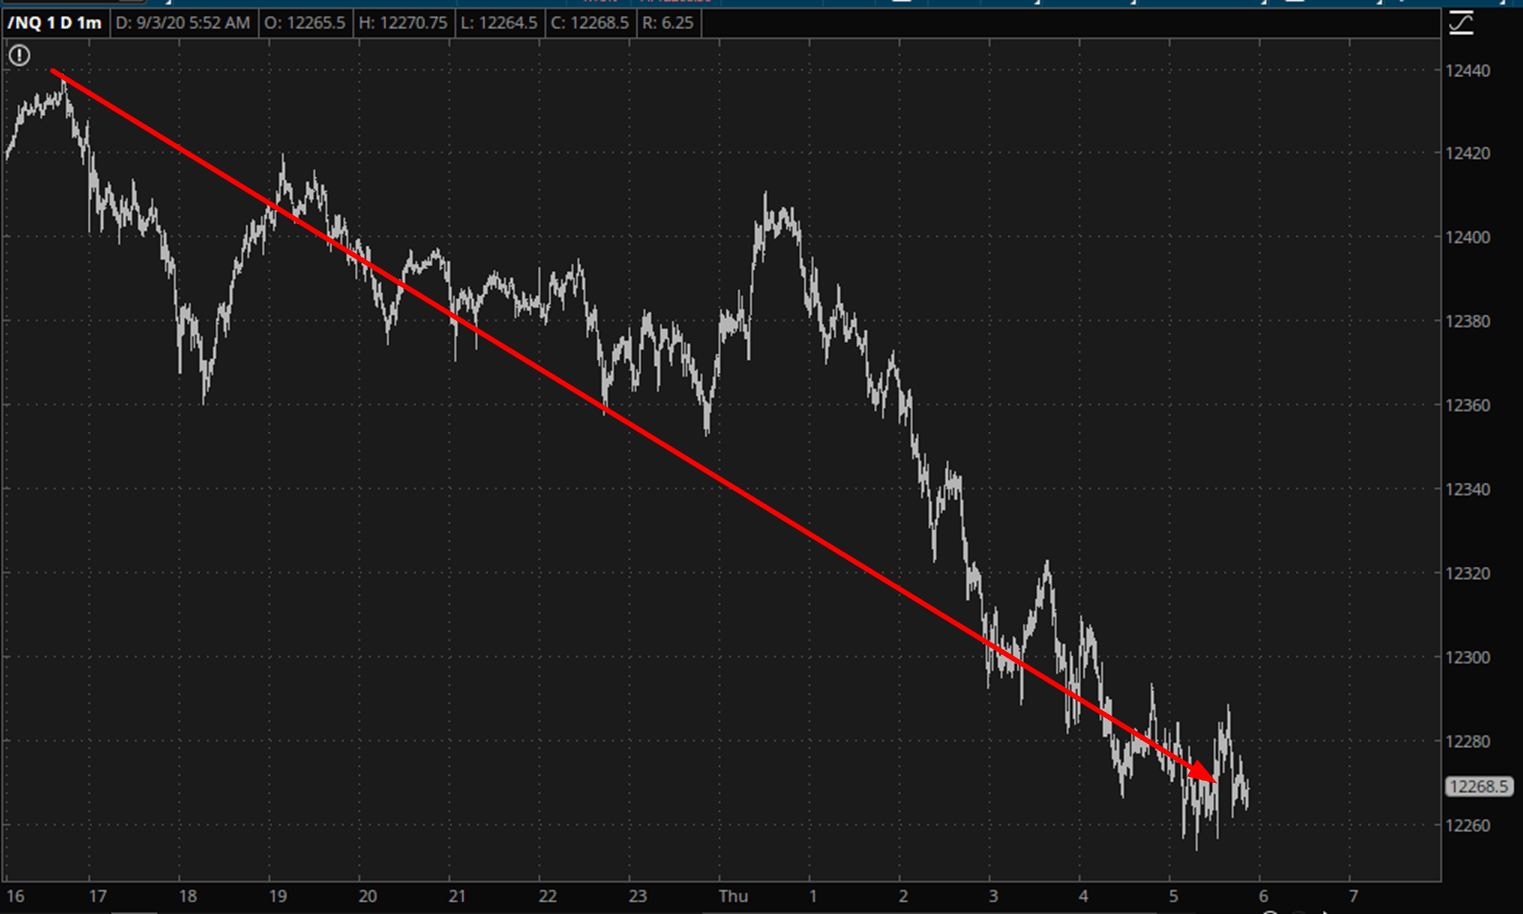
There was a time, boys and girls, when the NQ being down triple digits before the market opened would have been considered a pretty big deal. Exciting, even. These days? Absolutely, positively zilch.
Considering the fact that I’ve devoted just about 100% of my time and engineering resources to virtual trading – – something which doesn’t mean a single paying customer to me — one might wonder what I’m thinking.
Well, to be honest (which is a nettlesome habit of mine), there are two things I’ve got in mind:
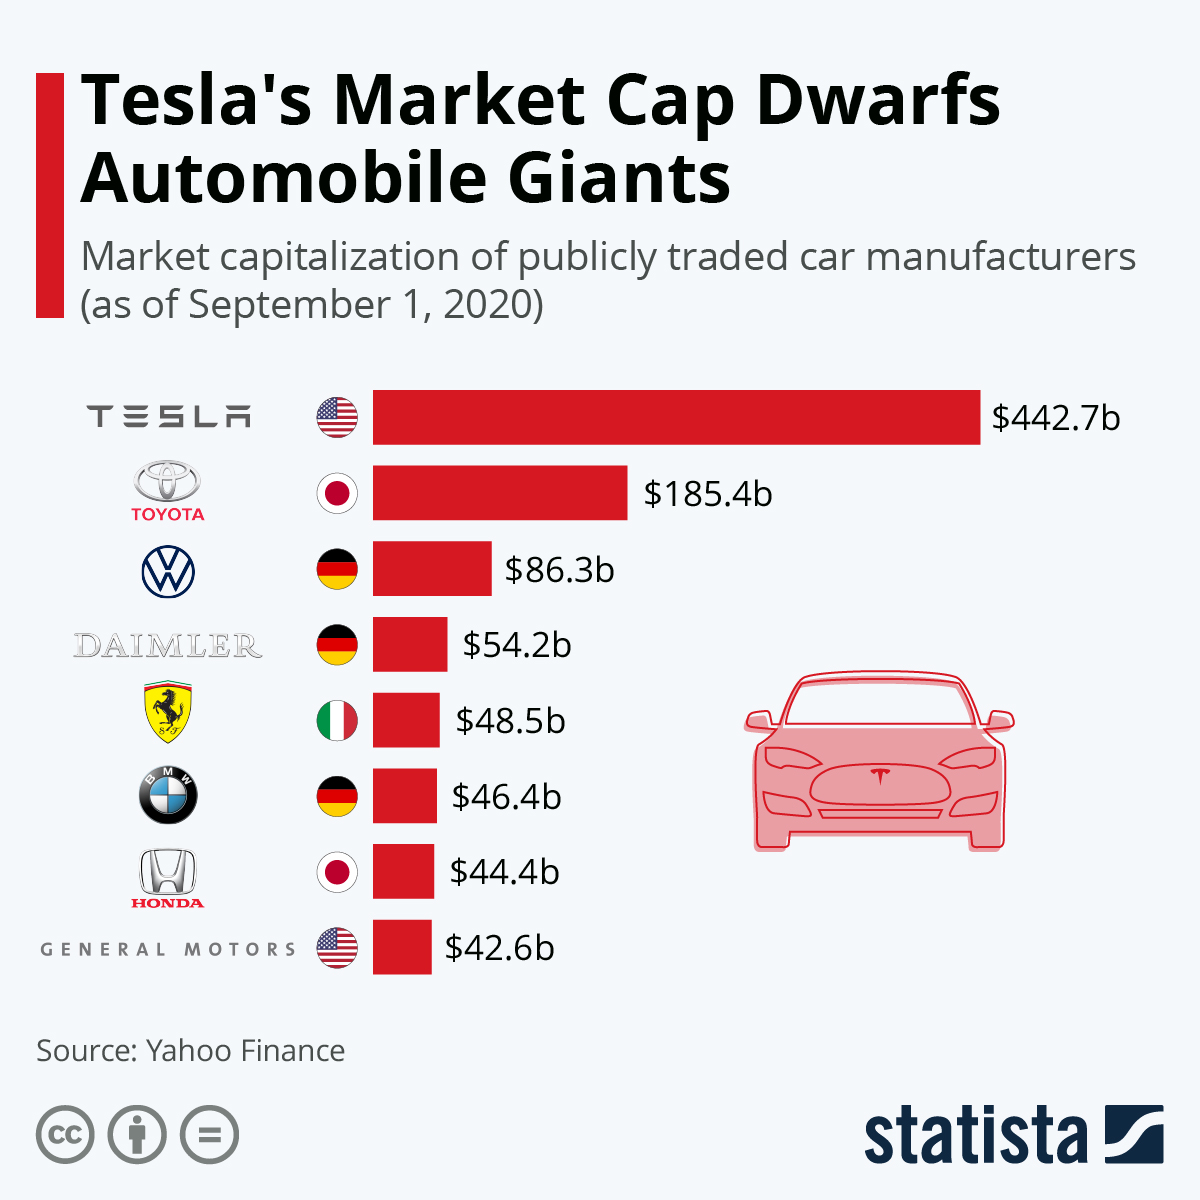
Truly one for the Museum of Insane Reality. Indeed, I just read over on ZH: “the carmaker became more valuable than 18 other automakers in the U.S., western Europe and Japan combined.”
 <
(more…)
<
(more…) The high earlier this year was at the main resistance trendline on SPX, starting at the low in March 2009, support at the low in 2010, broken as support in 2011 and then backtested as resistance then and several times since. The high yesterday was just shy of a full test and that has broken on the move up today, with visible breaks on both the weekly and monthly charts. That may just be a bearish overthrow on the bigger picture but it is still a huge break.
In the short term SPX is now about 8% over the 45dma, approaching the 8.7% over the 45dma reached at the June high, which was the most extreme high on SPX relative to the 45dma since 2013, though there may possibly have been more extreme highs before that I haven’t identified yet. This is a very extreme level and a retracement to the mean high must be close, and could be forming now.
(more…)