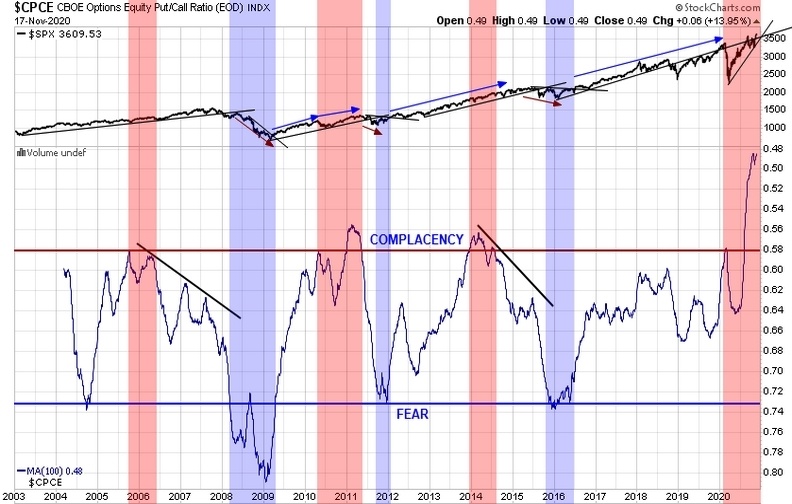
From last evening’s post regarding the measurement of complacency or fear in the markets by using the Equity Put/Call Ratio, I stumbled upon a way of timing when those transitions are underway.
It all started as I was comparing the large negative divergence in the SPX:VIX ratio to the large one I recall from 2007. As I began marking it up, a light bulb went off as I realized that ALL of the major Equity Put/Call reversals had a concurrent divergence on the SPX:VIX chart. I will plot them above each other for easier comparison.