
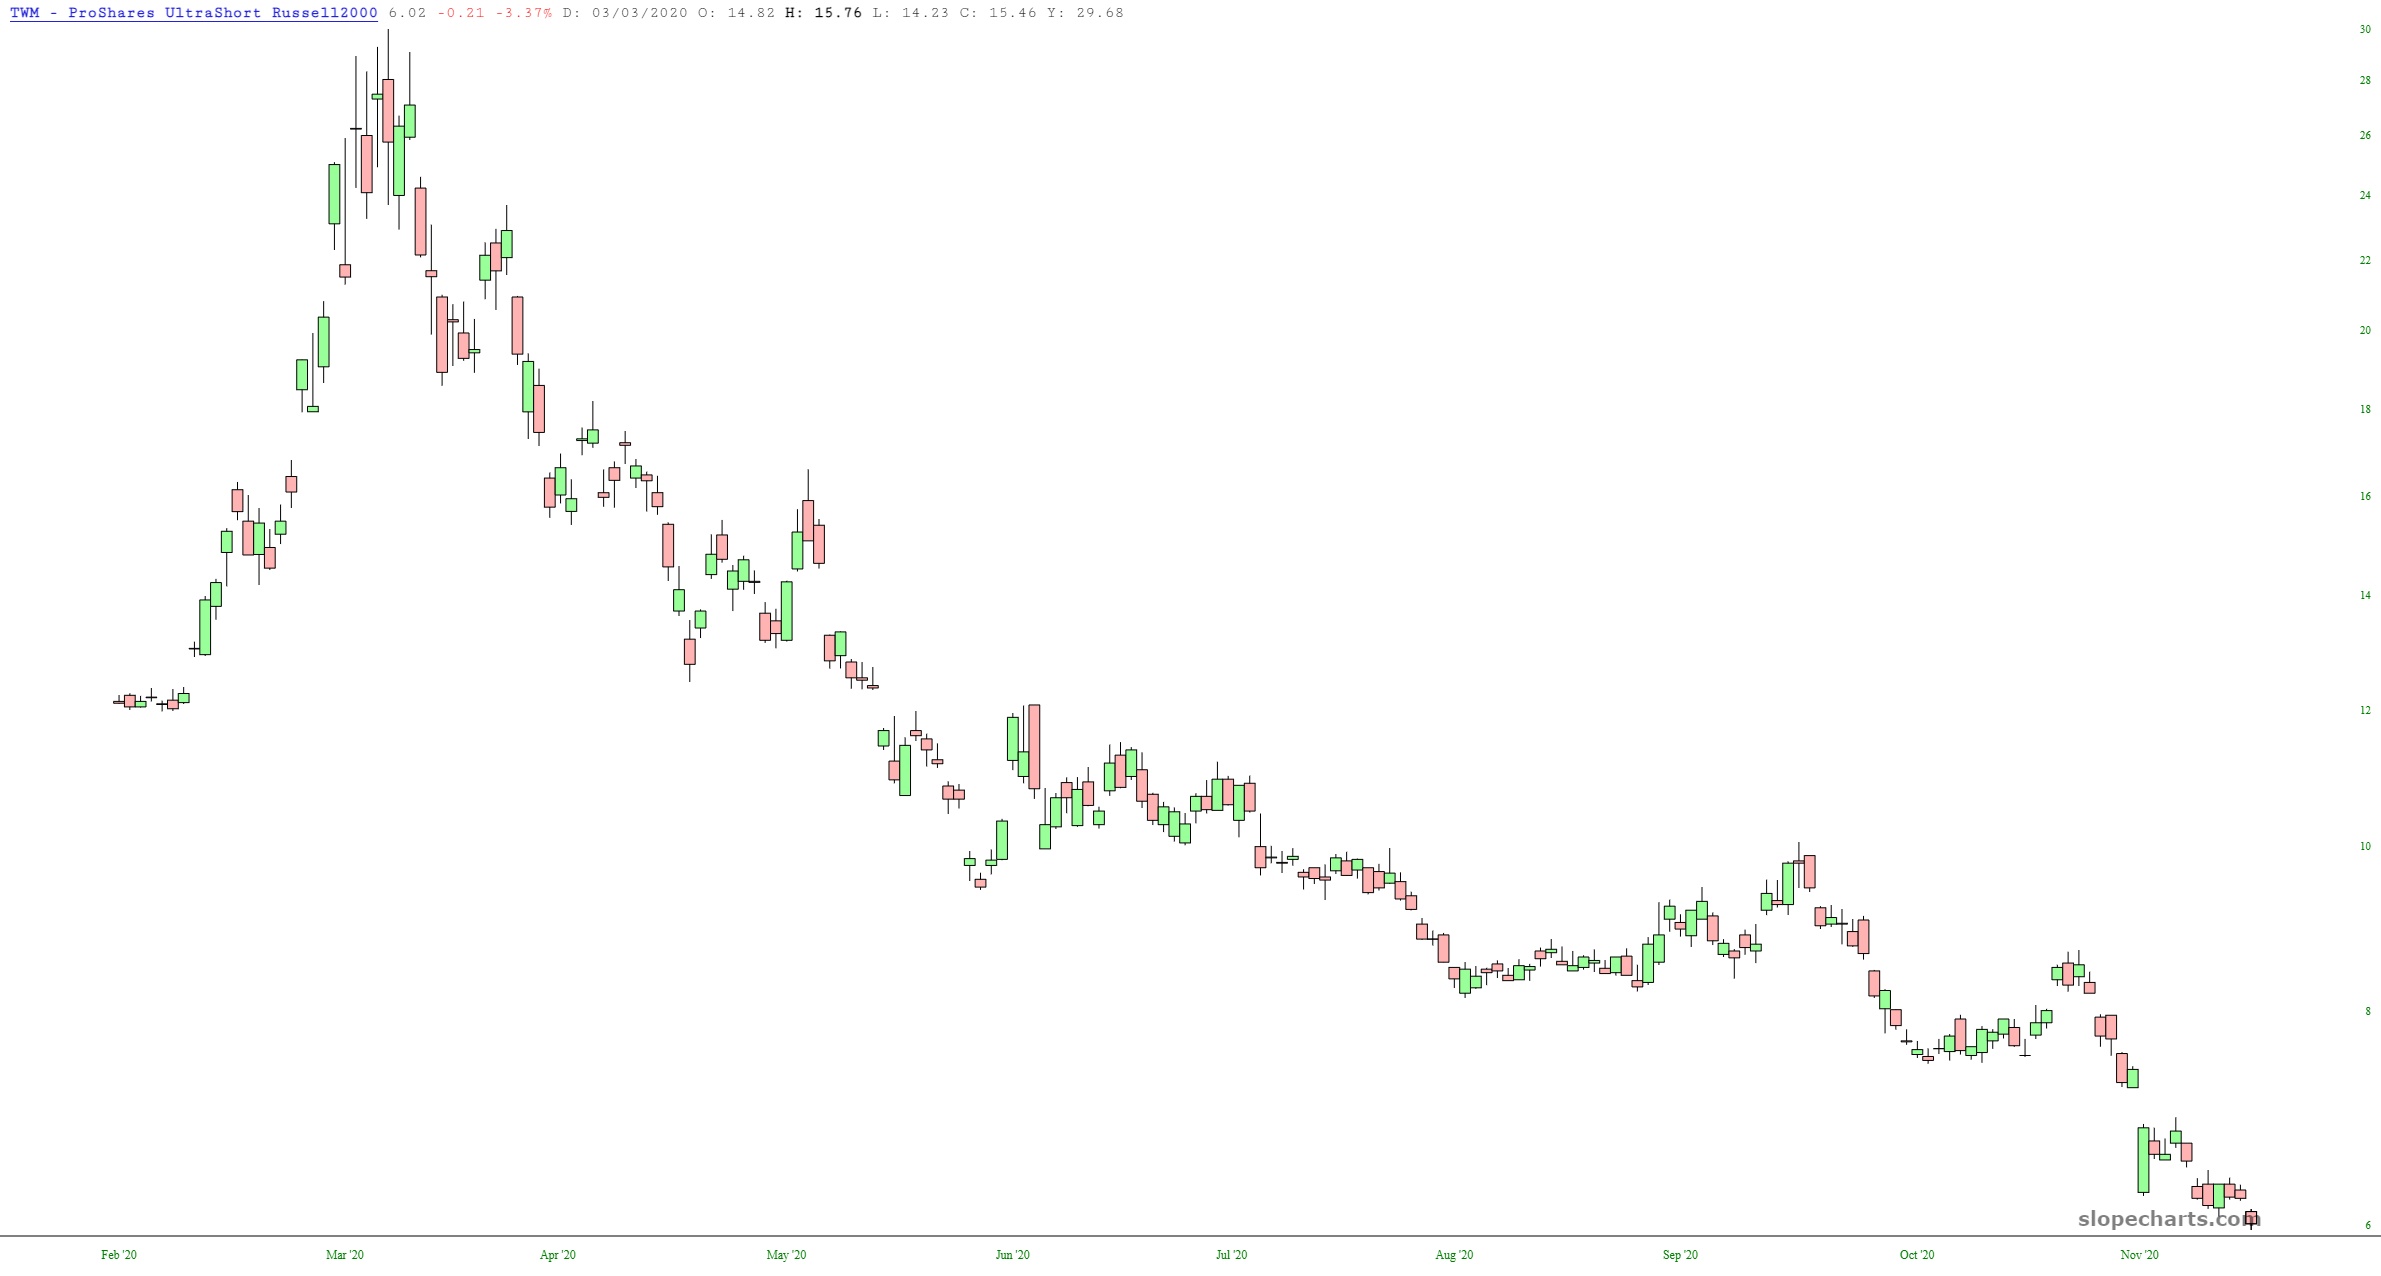
You can hardly turn around these days without seeing a headline which, in some form or another, says that the entire world is rotating into Small Cap Stocks, and that’s what 2021 is going to be all about. It’s hard to argue with this when the ultrashort against the Russell (symbol TWM) looks like this train wreck, having lost 80% of its value in seven months!
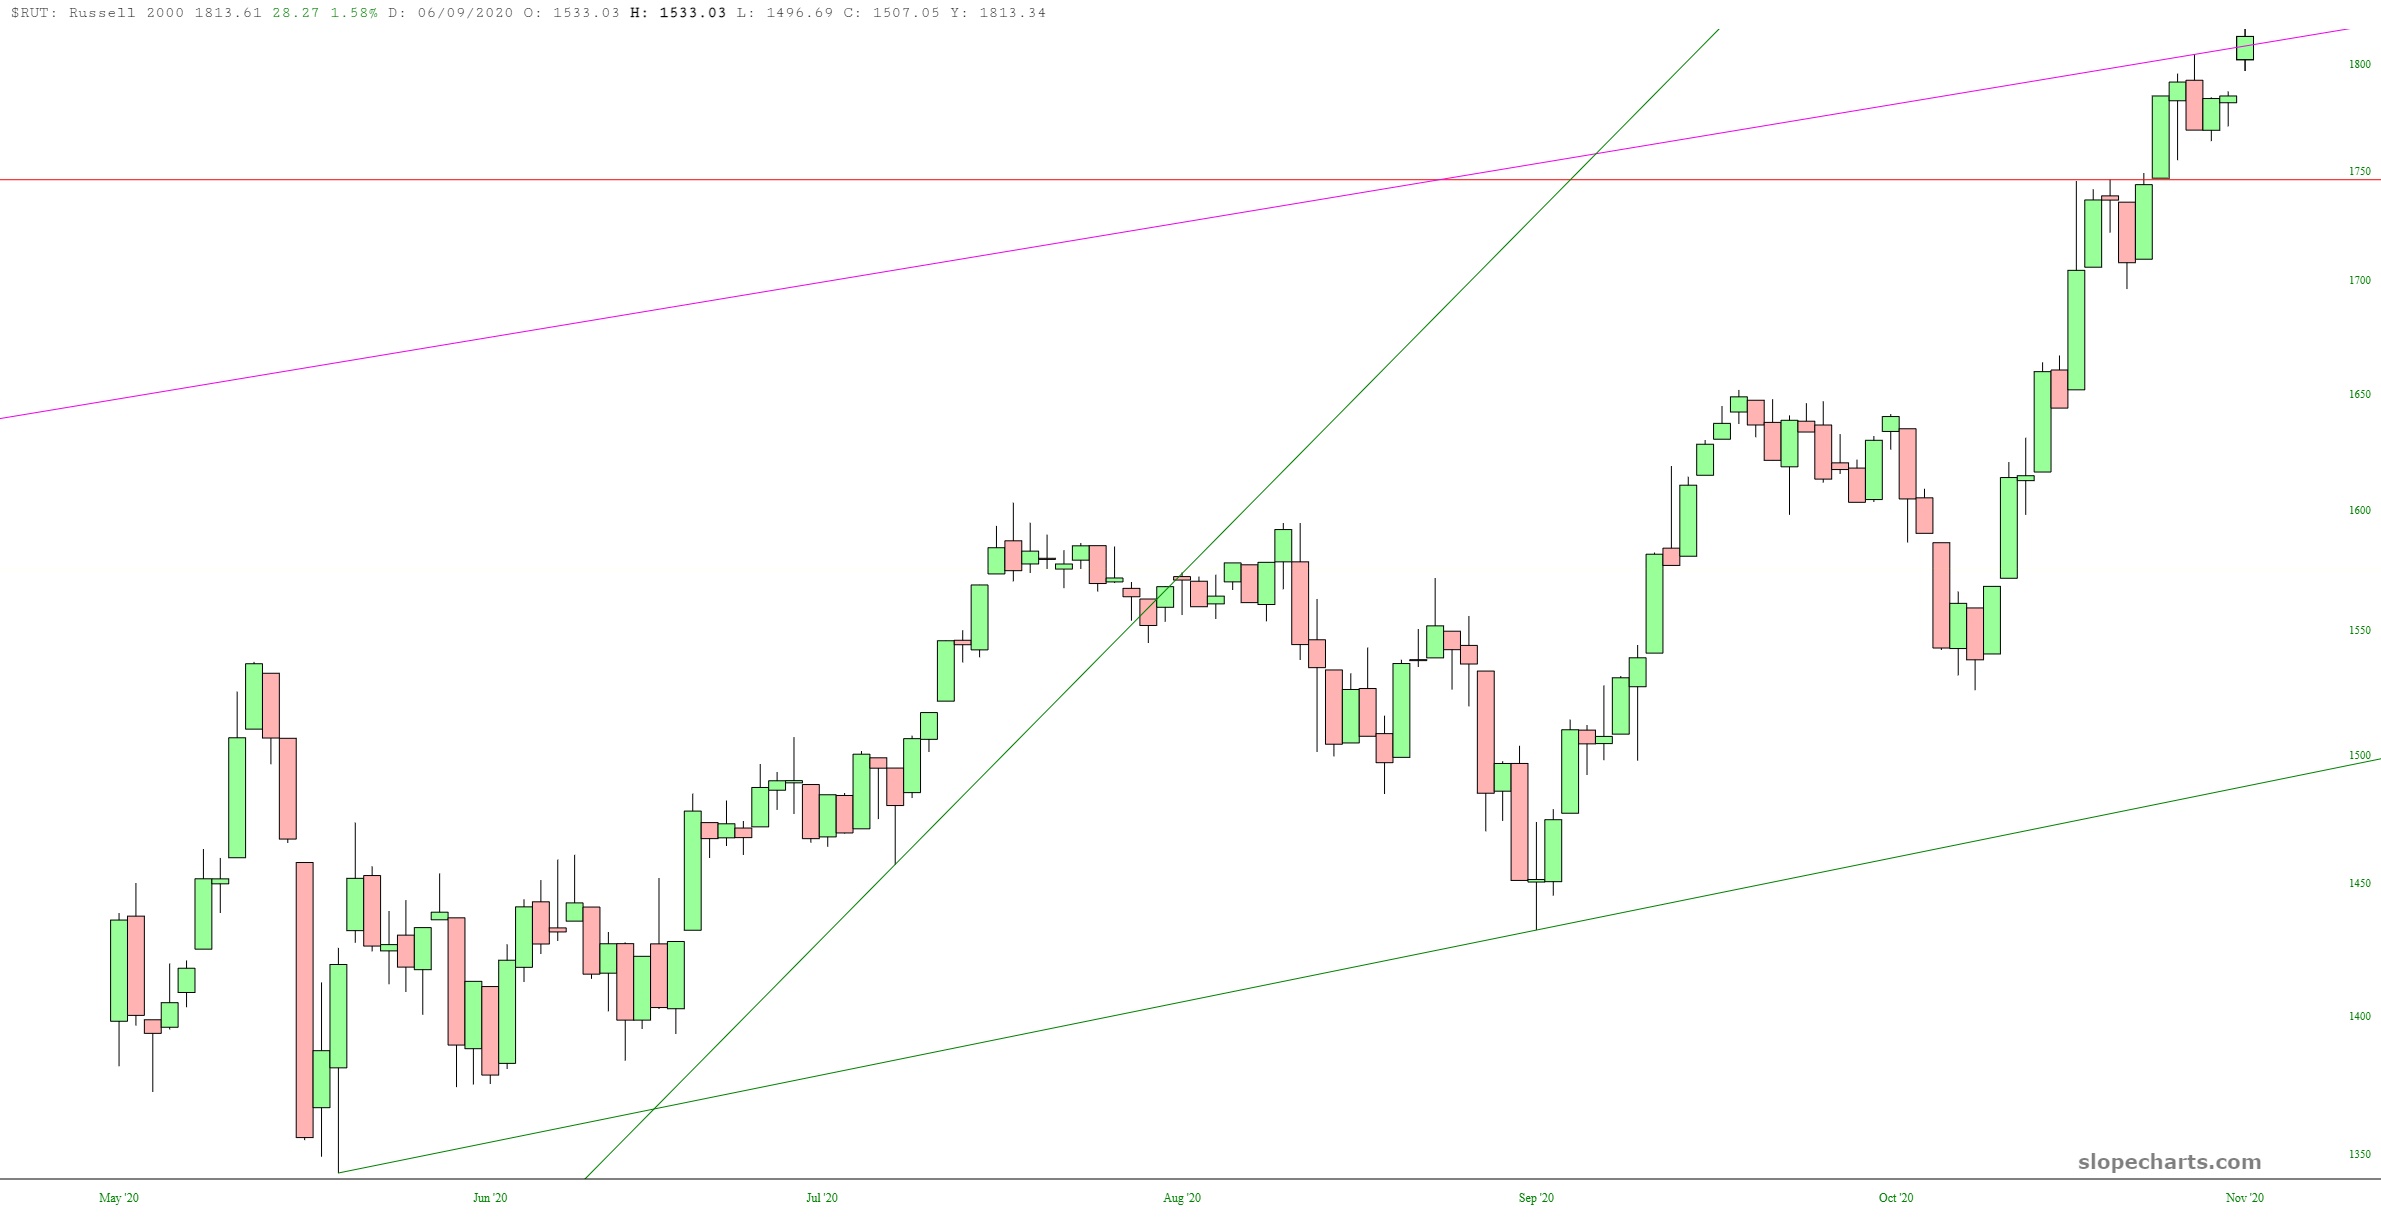
This is, of course, due to the Russell’s ceaseless ascendency, as it even pierces my once-beautiful and unviolated trendline to a new lifetime high:
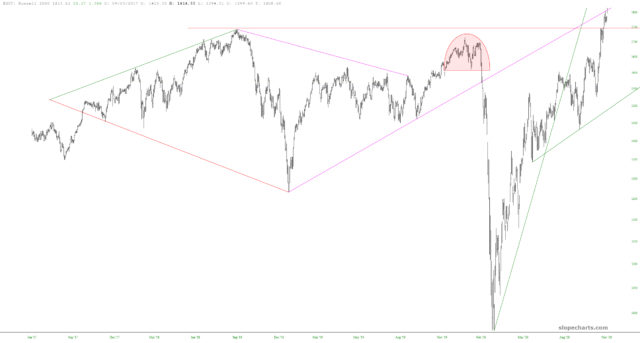
We can see, on closer inspection, what a champ this trendline has been until this very day.
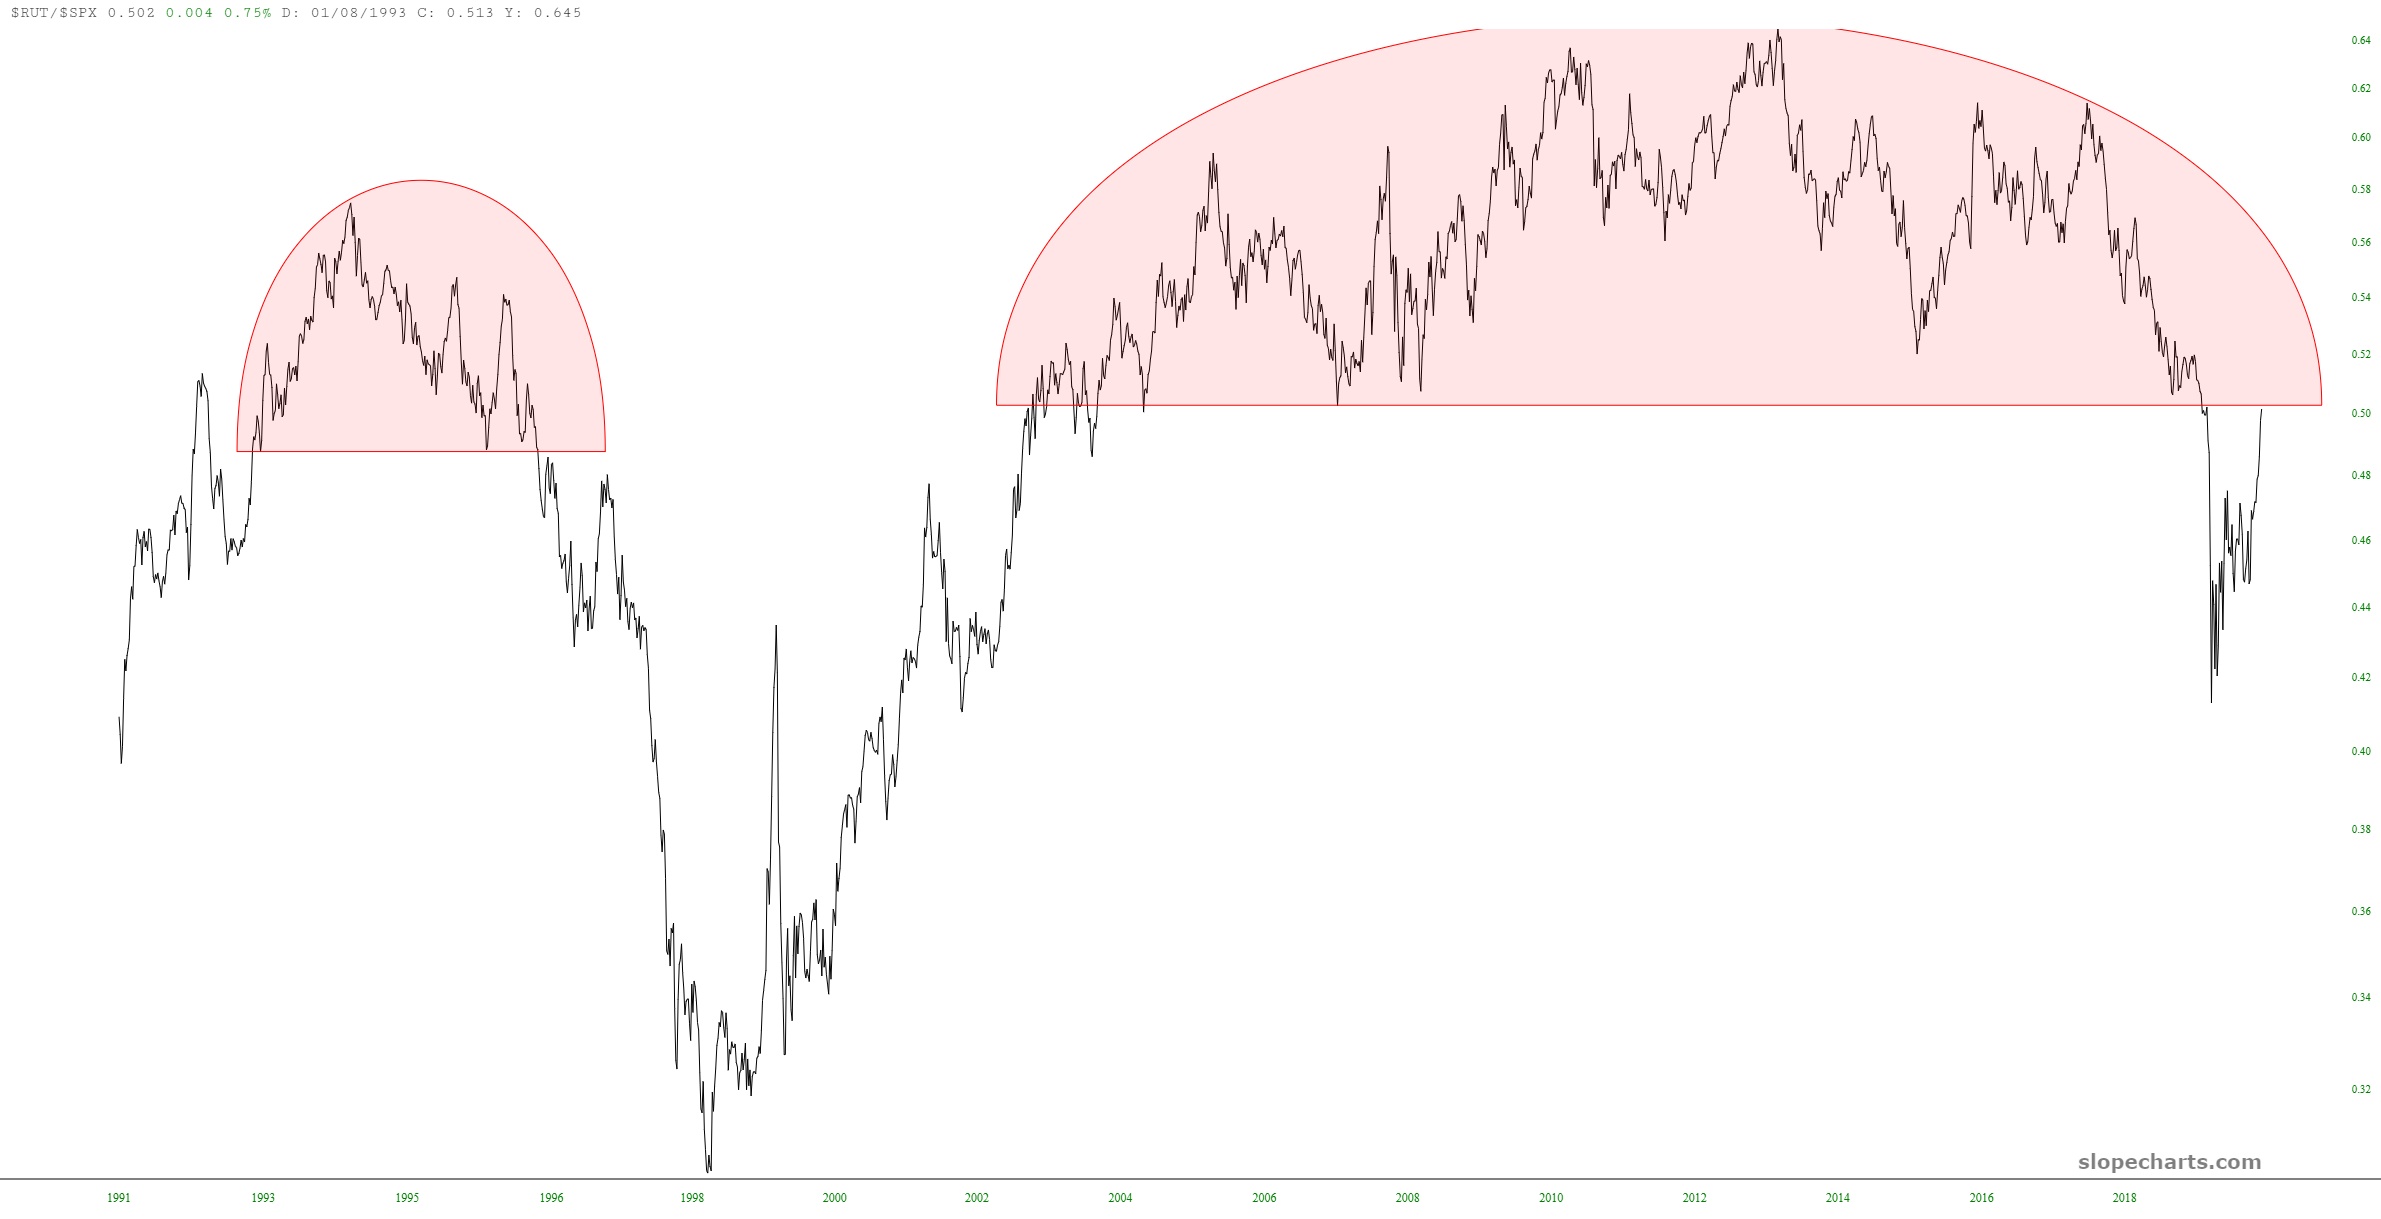
Allow me to take my hat from my head, hold it gently in my hands, and offer the following lunatic suggestion: that the ratio of the S&P 500 versus the Russell 2000 is an absolutely splendid, and monstrous, top.
Even if equities continuing going up until the year 9382, what the chart below suggests is that, at a minimum, the small caps are actually going to badly underperform the S&P 500, in sharp contrast to what everyone else on the planet Earth is saying these days.
(Fittingly, as I am typing out the text to this post, the $RUT is lurching to yet another lifetime high!)
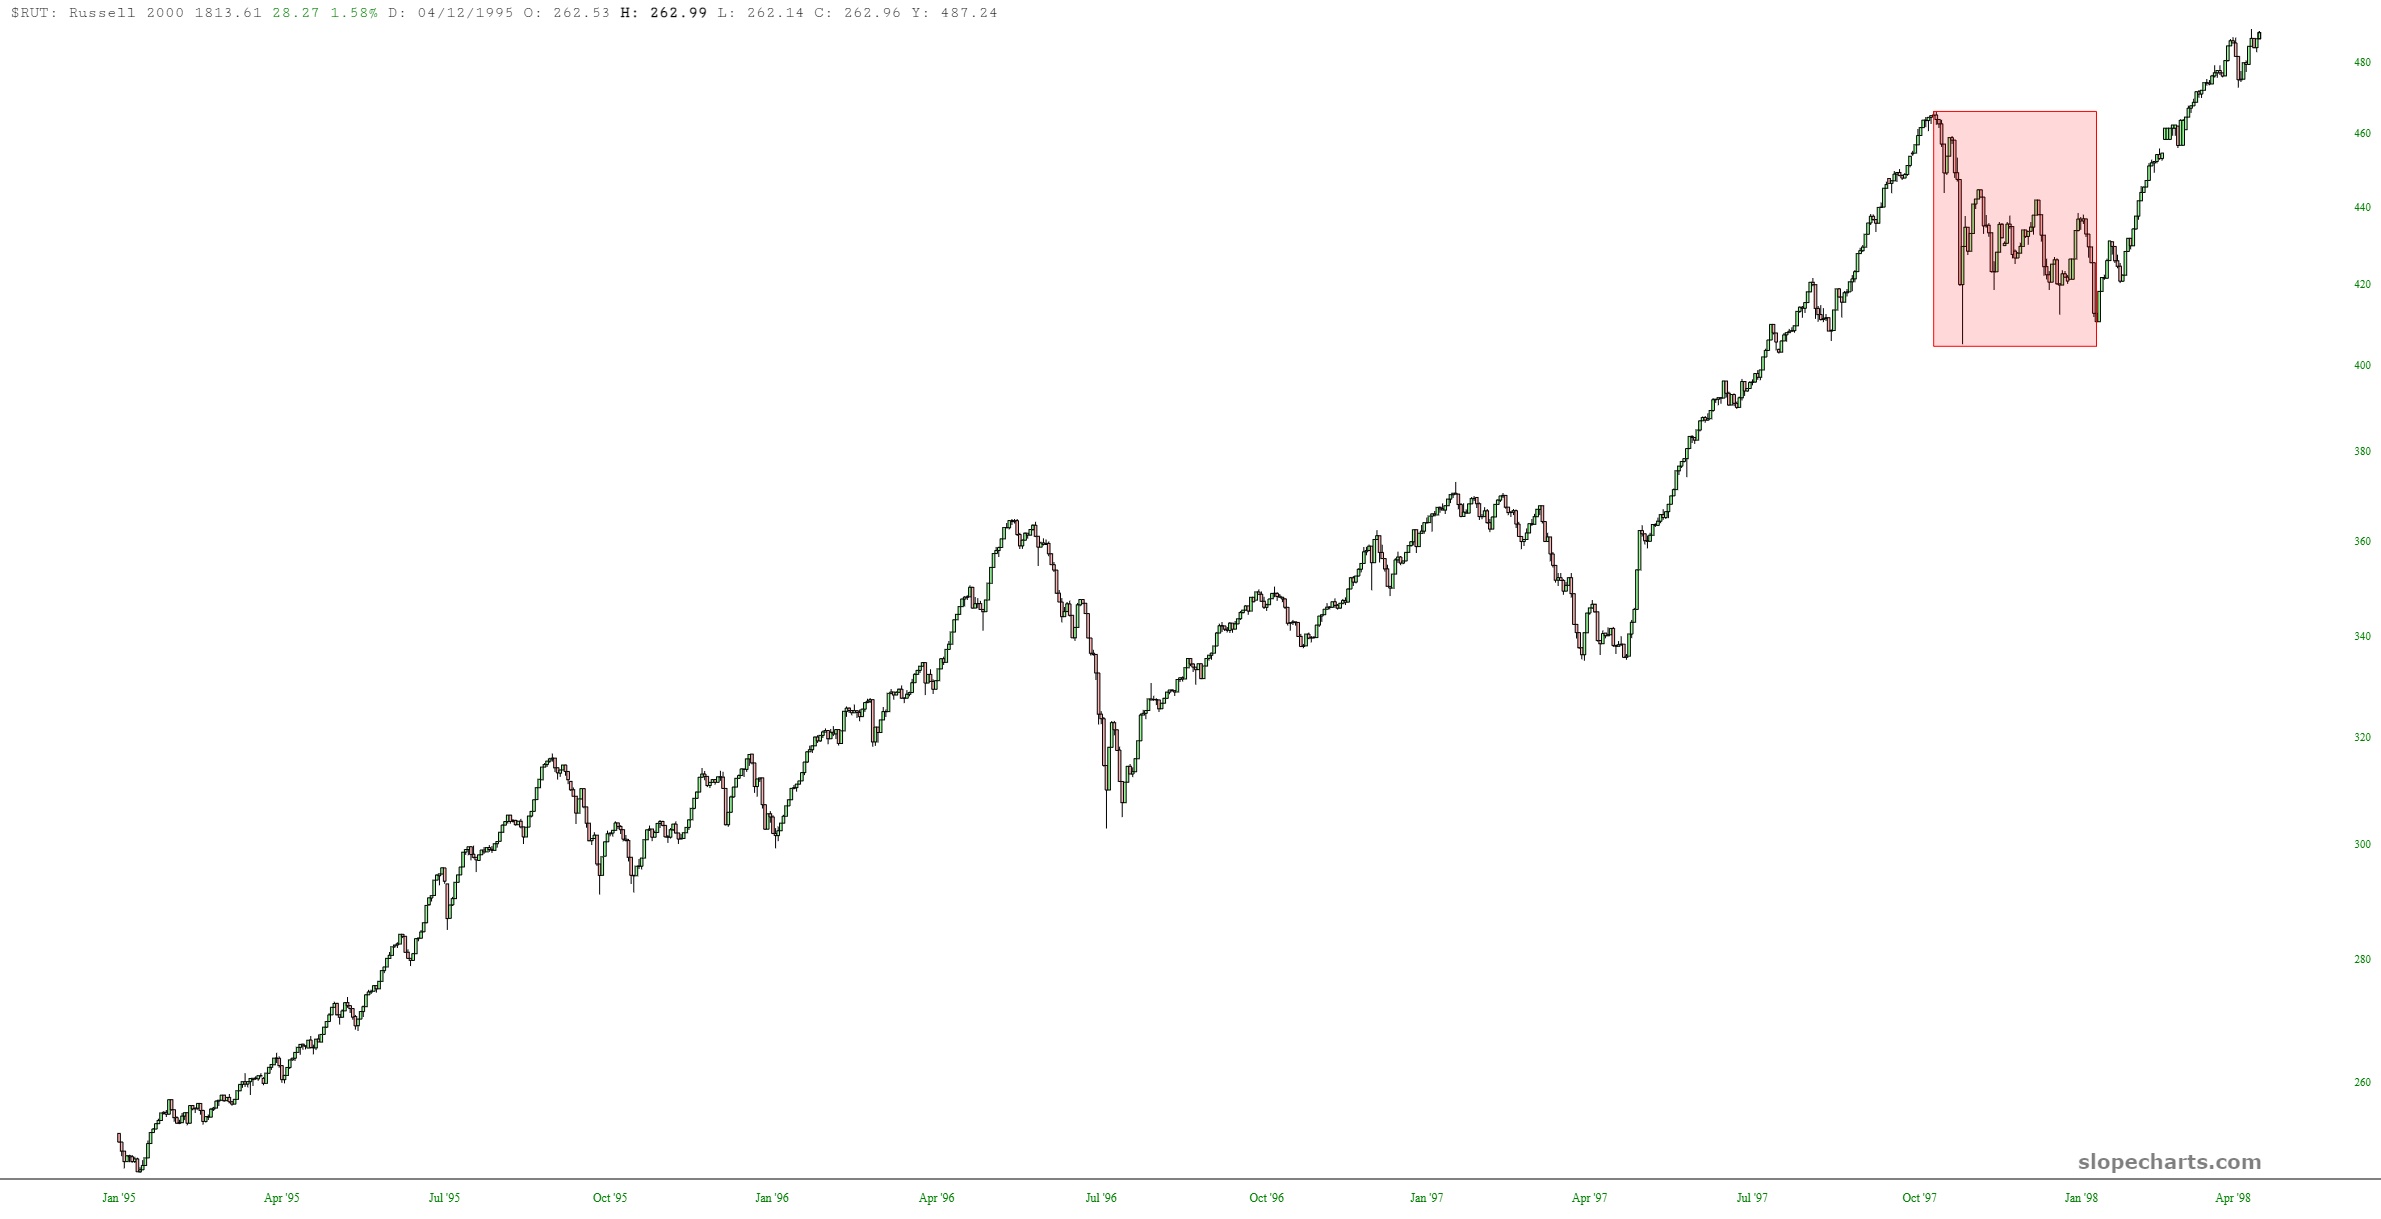
You may wonder what happened the last time the above ratio chart played out, albeit in a vastly small pattern. Well, it is shown in the chart below, which illustrates how, even in the midst of a monstrous and sustained bull market, the small caps actually turned tail for a few months.
The bottom line, for me, is that I’ve rarely seen a saucer top so large and well-formed as the ratio graph above.
