
How many other financial websites are introducing over 57,000 new charts to their site during a holiday weekend? I’d say a whole integer less than “one” is a good guess. Global Indexes are HERE! And they are instantly available to all Silver, Gold, and Diamond members.
As our Cyber Monday Special, we are offering Silver Memberships (giving you instant access to the Global Indexes, as well as all the other benefits of Silver), AT HALF PRICE which you can claim by clicking here. By taking advantage of this sale price, you will lock in an unprecedented 50% off the regular fee, and this ridiculous discount will be in place for life. In short, you are getting a Silver membership for the price of a Bronze, and you never lose the discount.
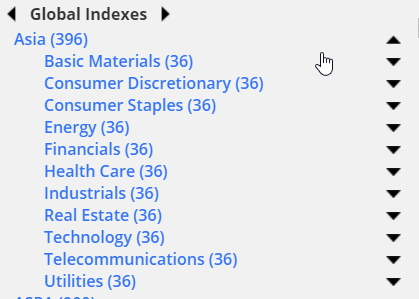
To get to this data set, go to the Data Panel (left side of SlopeCharts) and click either the right or left arrow at the top to navigate to the panel labeled Globex Indexes. In it you will find a scrollable list of countries from around the world, with the quantity of indexes for each country noted parenthetically after each country name:
The database is absolutely phenomenal – – over 57,000 distinct charts from all around the world. In the words of our data source:
“The Global Index Family is comprehensive, covering 57,200+ indexes of international securities segmented by geography, sector, and size. NASDAQ OMX’s transparent and rules-based selection method results in a complete representation of the global investable equity marketplace. The indexes cover 45 individual countries within Developed and Emerging Markets, and facilitate a multitude of tracking, trading, and investing opportunities.”
We have organized this gargantuan mass of information into something far more manageable than available anywhere else. First, click on the region or country of interest to you to reveal the sectors beneath. Each sector, similar to the country itself, has the quantity of indexes that are housed within the confines of each item.
By clicking on the next level of the hierarchy, which is a sector, you can see the individual, chartable instruments within. The “Index” at the top is the most basic one, but there are other presentations of this information with somewhat different formulas, such as “TR” (for Total Return) and, importantly, those modified to take into account differences in currency valuations. (AUD for Australian Dollar, CAD for Canadian Dollar, and so forth).
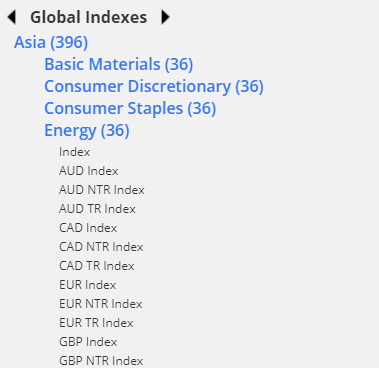
The value of these currency-adapted presentations is that an individual located in one of those countries can see the relative performance of that given instrument through the lens, so to speak, of his nation’s own currency. This is a more realistic representation of the performance of a given instrument, since the machinations of a local currency are taken into account when calculating performance.
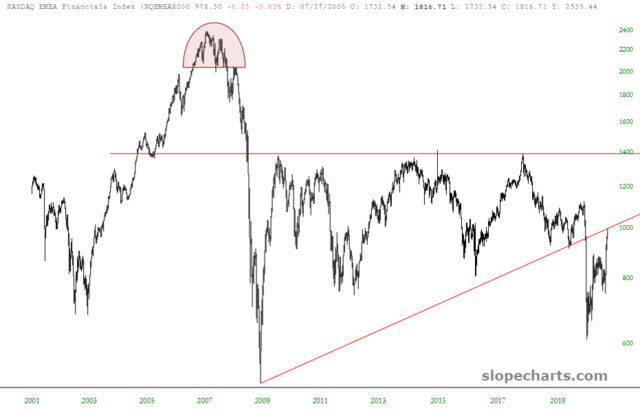
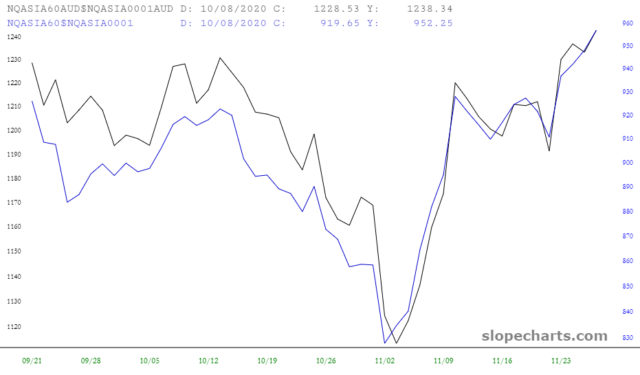
Because currencies do not typically move very dramatically, the charts will tend to look quite similar, but the differences are real, as illustrated by this simple comparison of one of the indexes presented with the Australian Dollar (black line) and the US Dollar (blue line).
This is clearly an overwhelming amount of information both in terms of depth and breadth. When you find any particular symbol you would like to preserve for easy access, right-click on the symbol and you can instantly copy it to the personal watchlist of your choice.
ONE MORE TIME: As our Cyber Monday Special, we are offering Silver Memberships (giving you instant access to the Global Indexes, as well as all the other benefits of Silver), AT HALF PRICE, which you can claim here. By taking advantage of this sale price, you will lock in an unprecedented 50% off the fee, and this ridiculous discount will be in place for life. In short, you are getting a Silver membership for the price of a Bronze, and you never lose the discount.
