
My last post was a couple of weeks ago now and in that time the retracement that I was expecting has been playing out, though the main target, rising support from the March low, now in the 3745 area, has not yet been tested, and may well not be before we see a high retest.
Why is that? Well the patterns forming here look like bear flags, and while the low this morning overshot my ideal bull flag channel support on SPX by five handles or so, the action today has only strengthened the case that the next move is likely to be a retest of the all time high on SPX.
Before the open this morning I was noting that hourly buy signals had fixed on ES, RTH and YM, and since then hourly RSI 5 buy signals have fixed on SPX and IWM, with another brewing on INDU. There is a lot of upward pressure building here, and as well as the clear bull flag , the retracements so far on RTY, DAX & ESTX50 all also have the look of bull flags forming.
I was also noting this morning that today is the last trading day of February, which leans about 67% bearish historically. The first day of March leans about the same distance to the bull side, so I was suggesting before the open that ideally there would be a low made in the 3790 ES area today before a move started, boosted by the bullish stats on Monday, that might well deliver the all time high retest. The low was at 3784 ES, which was a shade low, but so far I’ve seen nothing to change that view.
I was saying a couple of weeks ago that while equities have clearly been in a strong bull trend, trendlines and patterns have still been working well. I think my point has been made since then, and I’d particularly note the lovely H&S that formed on SPX and set up the first move to the 3800 area, which I called in my premarket videos as the obvious path down early last week. If I have time I’m going to be extracting that section and posting it as a particularly nice call.
SPX 60min 4Mo chart:

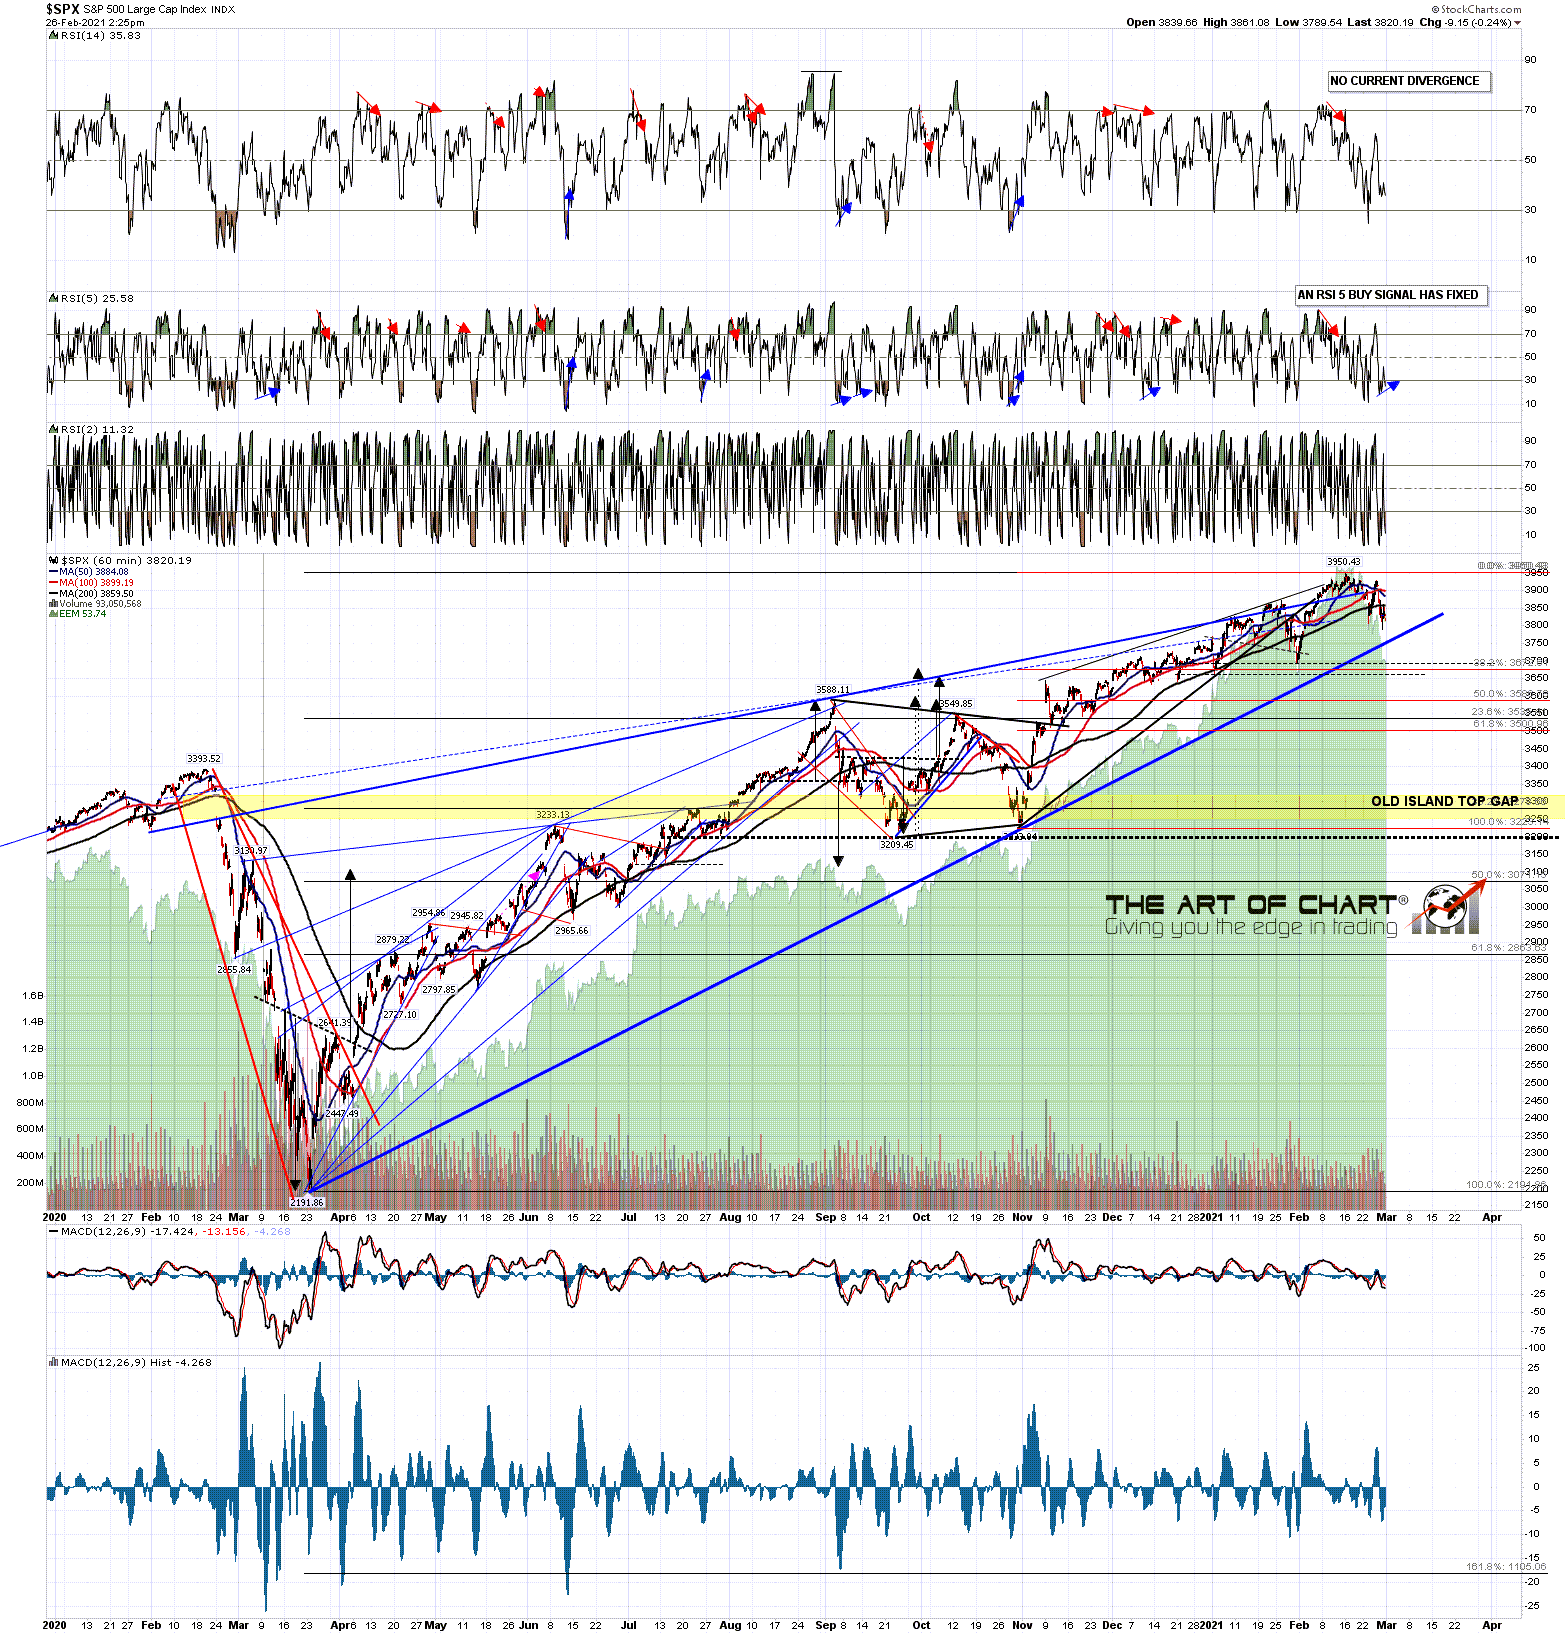
On this larger timeframe SPX hourly chart you can see that rising wedge support from the March low is now in the 3745 area. In the event that we do see more downside short term then that would be the obvious next target, though as I said, the setup here favors bull flags forming, so we may well see that all time high retest first.
SPX 60min 14Mo chart:
On the SPX daily chart, if we are going to rally from here, the next step would be a close back over the daily middle band, currently 3876 area and supported as resistance by the 5dma in the same area, and the 50 hour MA now at 3882. Once these levels have been broken (daily close basis), and converted to support, a break of the bull flag resistance on SPX should deliver an all time high retest.
SPX Daily chart:

We are doing our monthly public Big Five and Sectors webinar at 5pm EDT On tonight so if you’d like to attend you can sign up for that directly here, or from our February Free Webinars page.
Everyone have a great weekend. 🙂
