
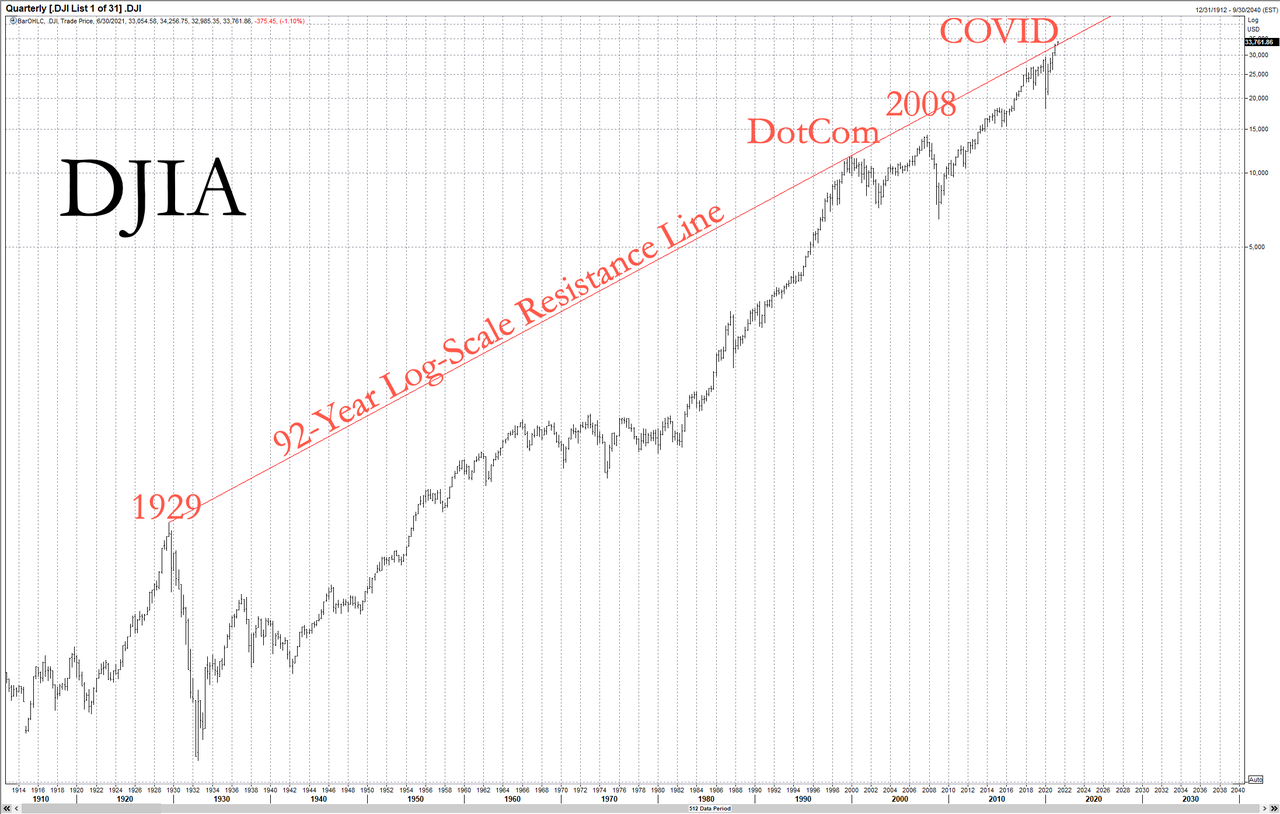
Moments ago, I saw that ZH ventured into an area that they normally don’t, which is classic technical analysis (which is, I say selfishly, kinda my thing). They offered up this long-term chart of the Dow:
I was naturally intrigued, particularly when they showed the zoomed-in portion:
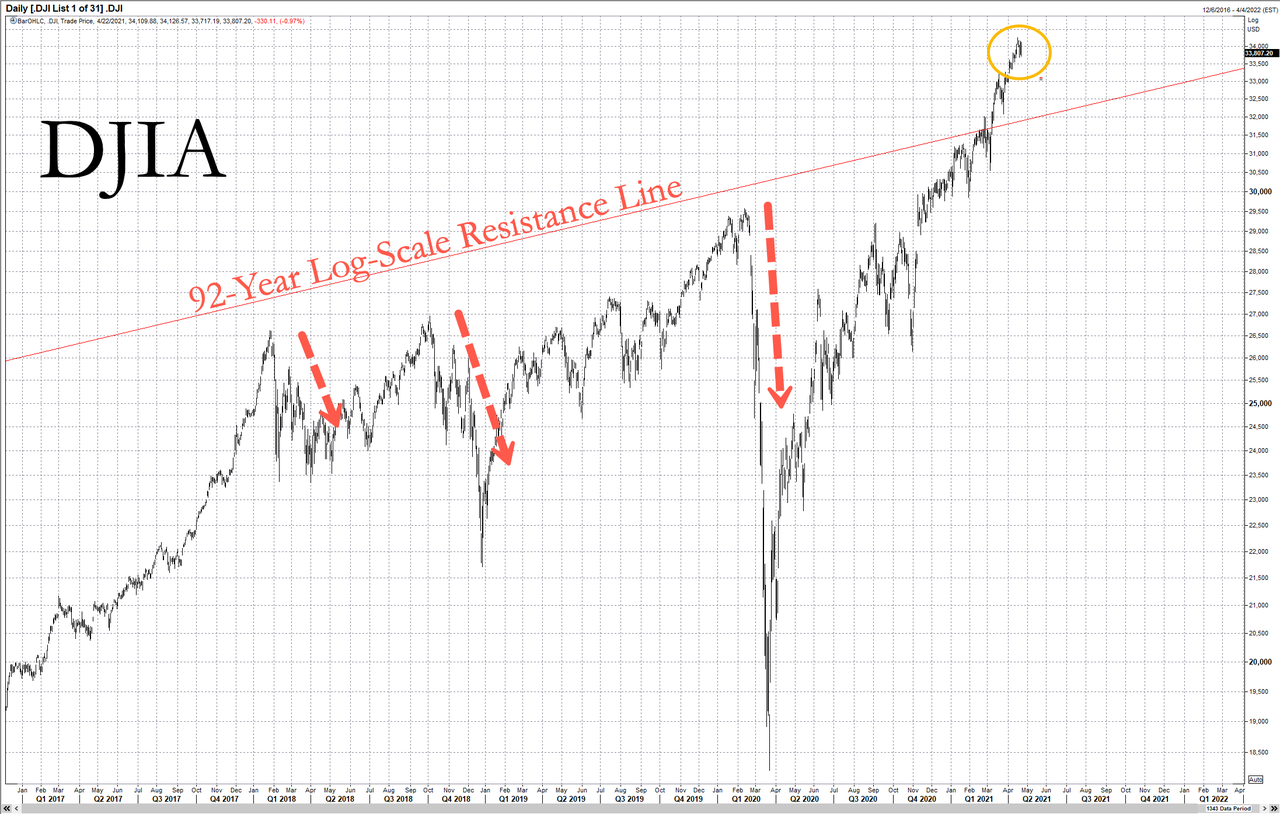
When I saw that trendline floating around in empty space, my Oh I Could Do That So Much Better detector started beeping frantically, so I fired up SlopeCharts.
Here is the Dow Industrials, going all the way back to when people still used horses to get around and having running water in the house was a luxury. Take careful note of that gorgeous channel pattern from the peak of the Roaring Twenties to the present Fiat Twenties:

Let’s zoom in to the last quarter century, which begins with the Internet bubble and comes right up to the present. As you can see, we last tagged that century-long trendline in 1999, and then we did so repeatedly in the past few years.
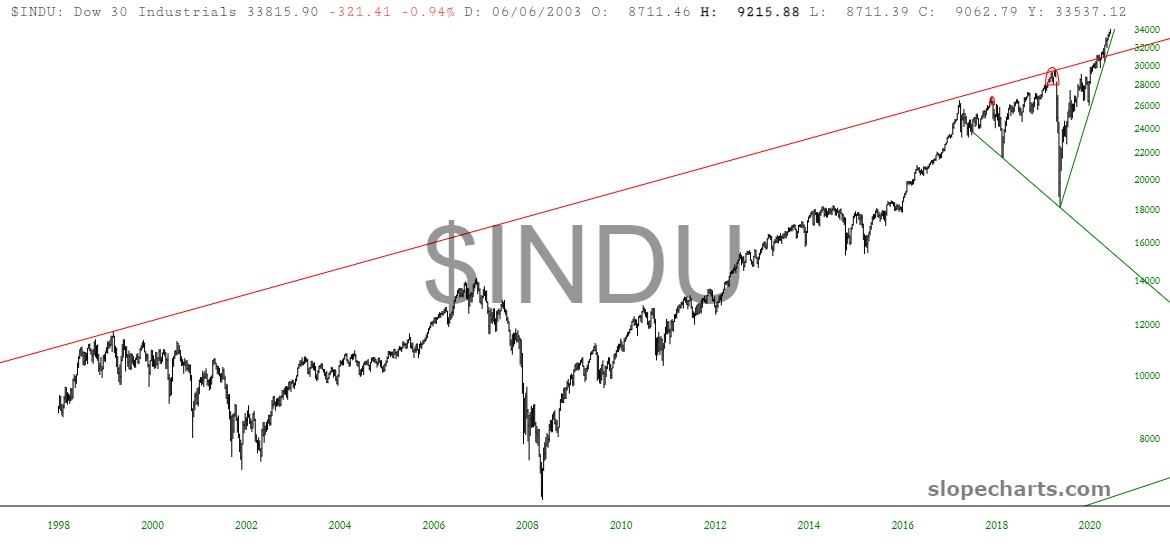
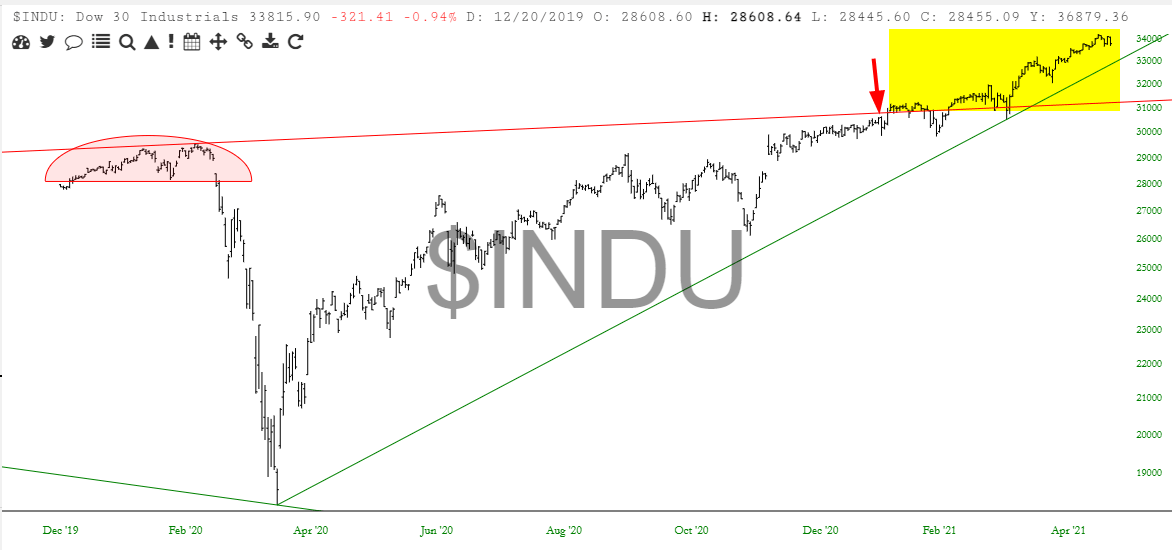
Let’s zoom in further still. We can see, tinted in pink, numerous times when the market “topped out” and took a fall. The last time this happened was at the beginning of 2020, which is when we got the most exciting fall in the market in a dozen years. Since then, it has been, thanks to Powell’s trillions and trillions of J-Bux, vomiting higher without a care or concern, shattering the bounds of a resistance line that had been in place for a solid century.

This is what I call the J.P.S. zone, which is Just Plain Stupid. What I mean by that is that long-term patterns matter. The longer they are, the more they matter.
Late in 2019 and early in 2020, it’s not like the world was devoid of assistance from the central banks of the world. On the contrary, the central banks have been drowning the markets in “help” since 1987, and that “help” went into overdrive starting in 2008. Even so, the trendline continued to be obeyed, and all holy hell broke loose in February 2020 without one moment of warning. Thus, we should have fallen again – – quite hard! – – starting two or three months ago, and yet we’re out here in the ionosphere.
When the next fall comes, I think it’ll be even more violent than what we saw during the Covid Crash, and the things that the government uses to fix it will be even stupider than anything else they’ve done in the past (if you can imagine).
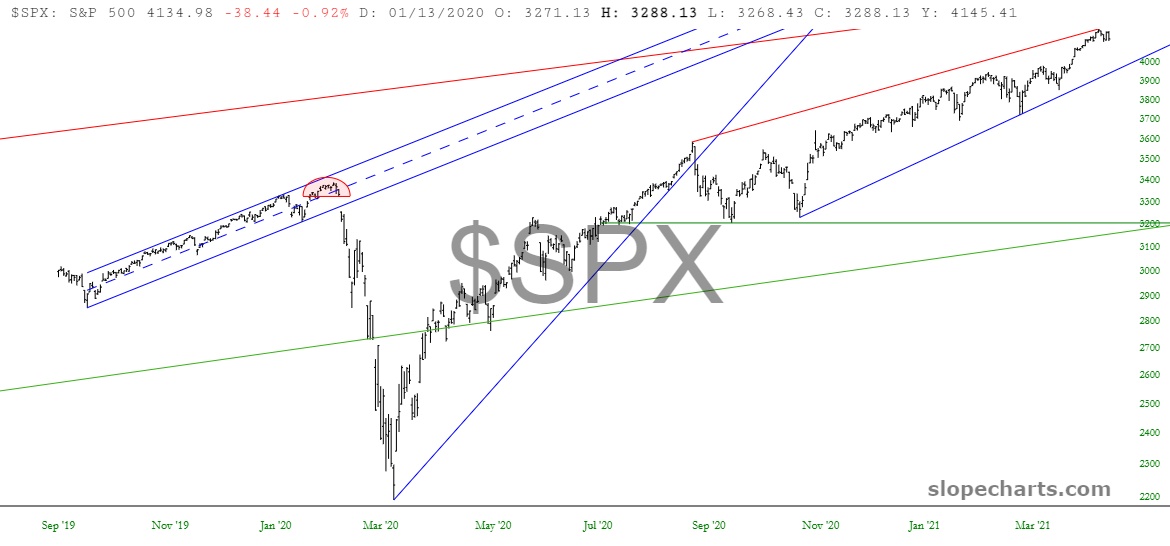
I would also state that if you look at a broader equity index, such as the S&P 500, its own patterns quite plainly show what a precarious position equities are in right now.
Selfishly (there’s that word again), I would love this idiotic and totally fake bull market to go on for a little while longer, mainly because I was one of the first investor in a company whose value has gone from $7 million to almost a billion dollars, so, yeah, I’d LOVE to get out at the top. If the world blows up, well, I’ll be the proud owner of a lovely stock certificate of a private company, suitable for framing.
Last time I checked, though, the market didn’t really care much what Tim Knight thinks. I hope you do, though, which is why I shared the charts above. The levels we are at are Just Plain Stupid, and this ain’t gonna last. Honest.
