
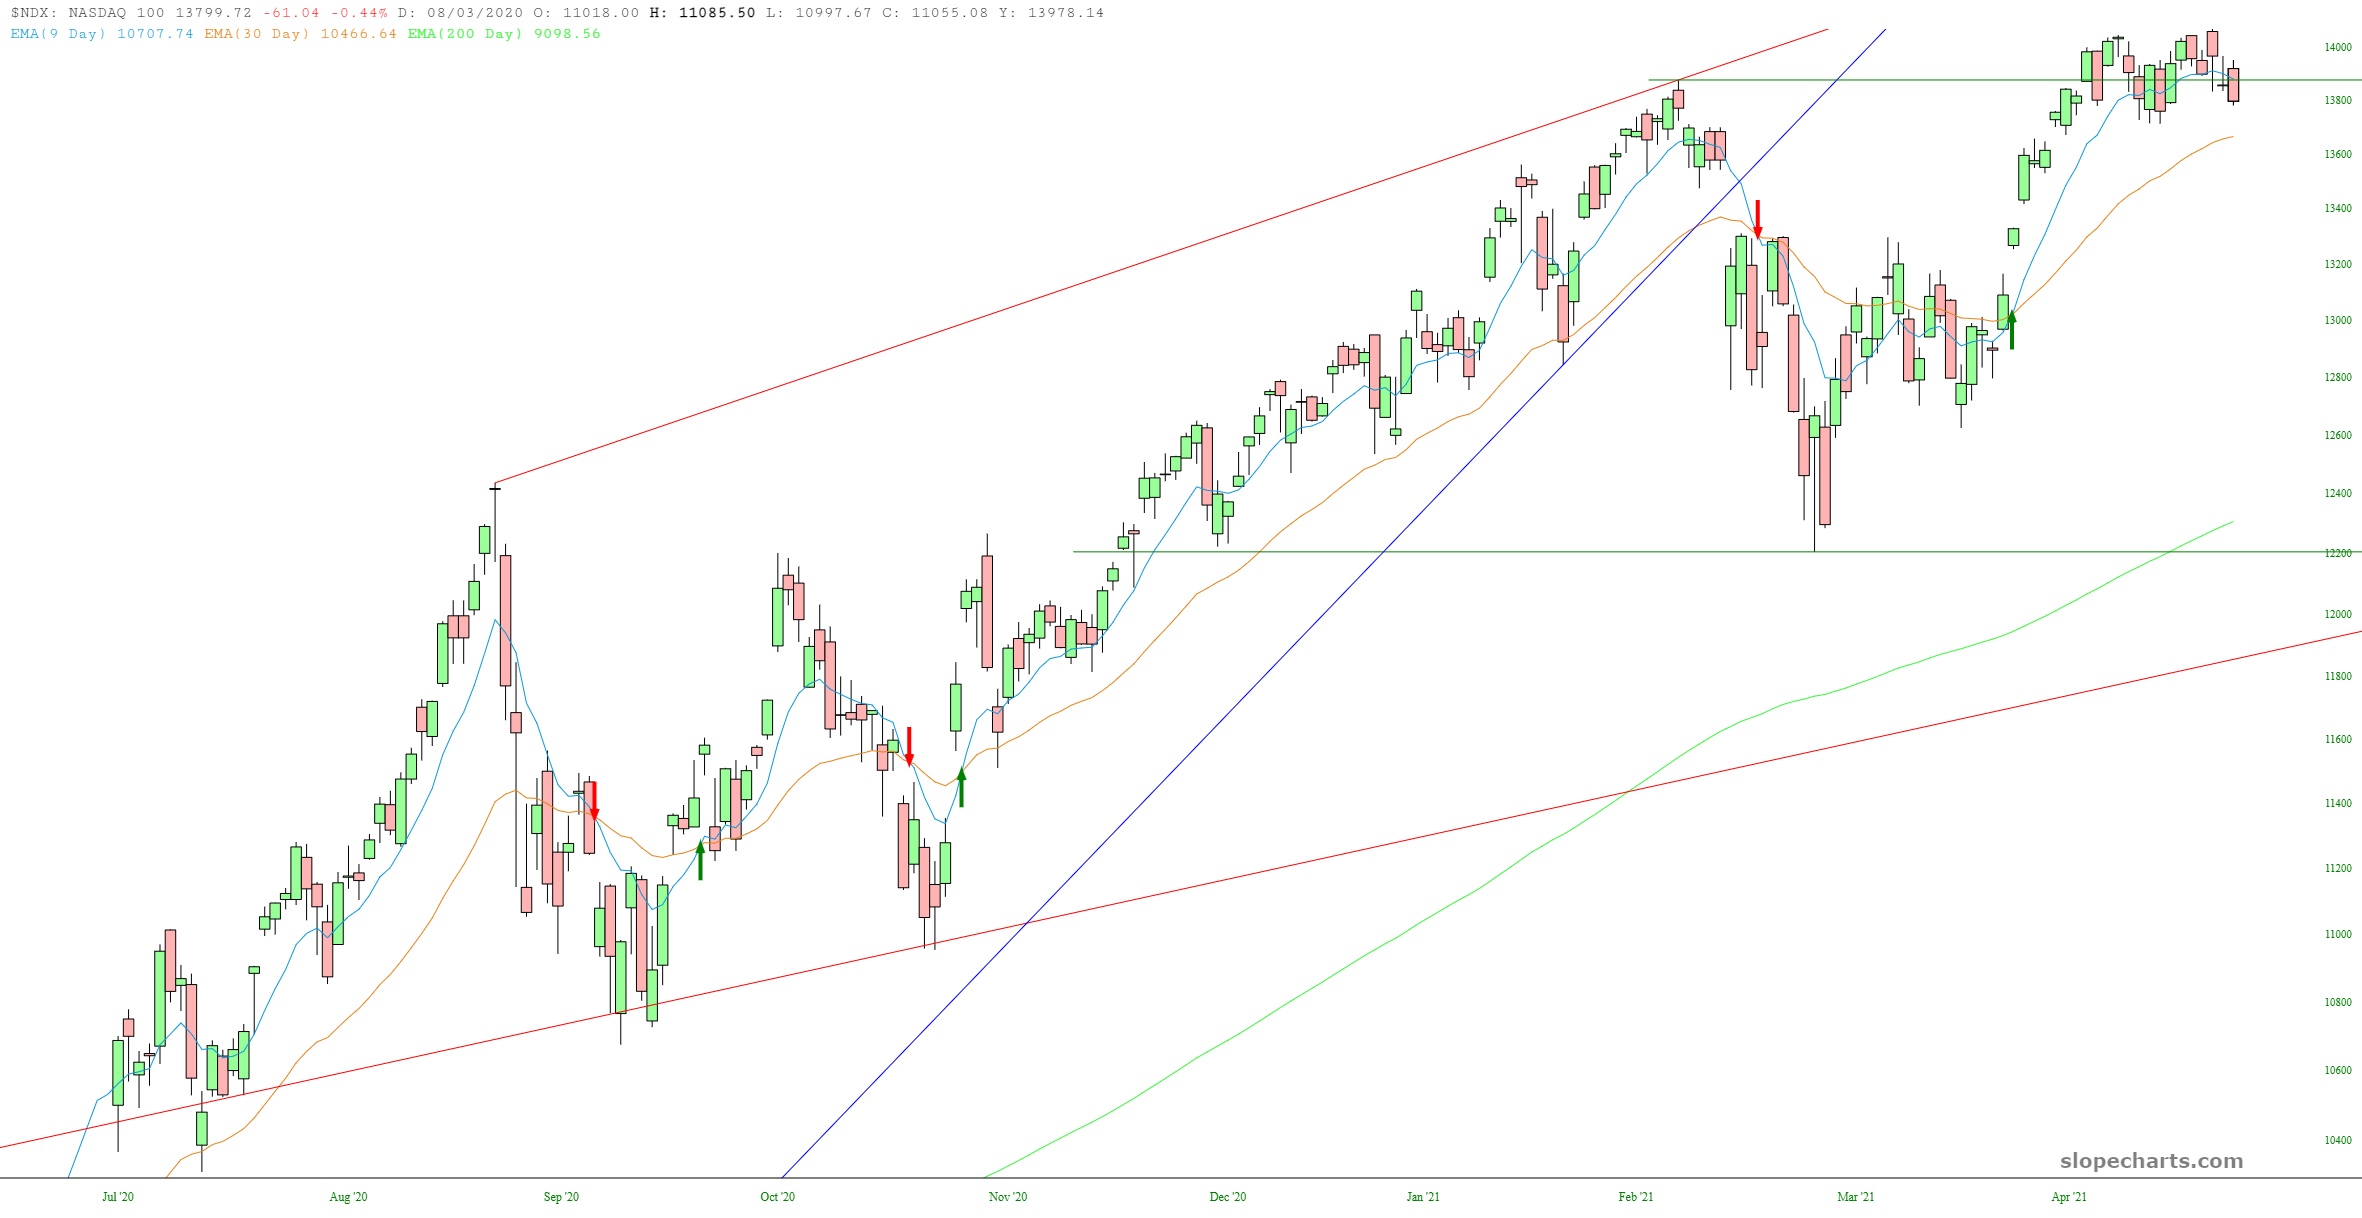
As just about every asset in existence has spent 2021 making daily lifetime highs – – be it lumber, Ethereum, Google, Bitcoin, or anything else you can name – – tech stocks have recently been losing their steam. For example, below is the NASDAQ 100, paired with tacoflyer’s moving average trio, and you can see how over the past three weeks we’ve basically stalled out. I would also note the shortest-term moving average has done a U-turn and is threatening a cross-under of the middle moving average. (These tend to be lagging indicators, just like all indicators are, so waiting for the crossover may be prudent, but it also means a good chunk of the move is probably over).
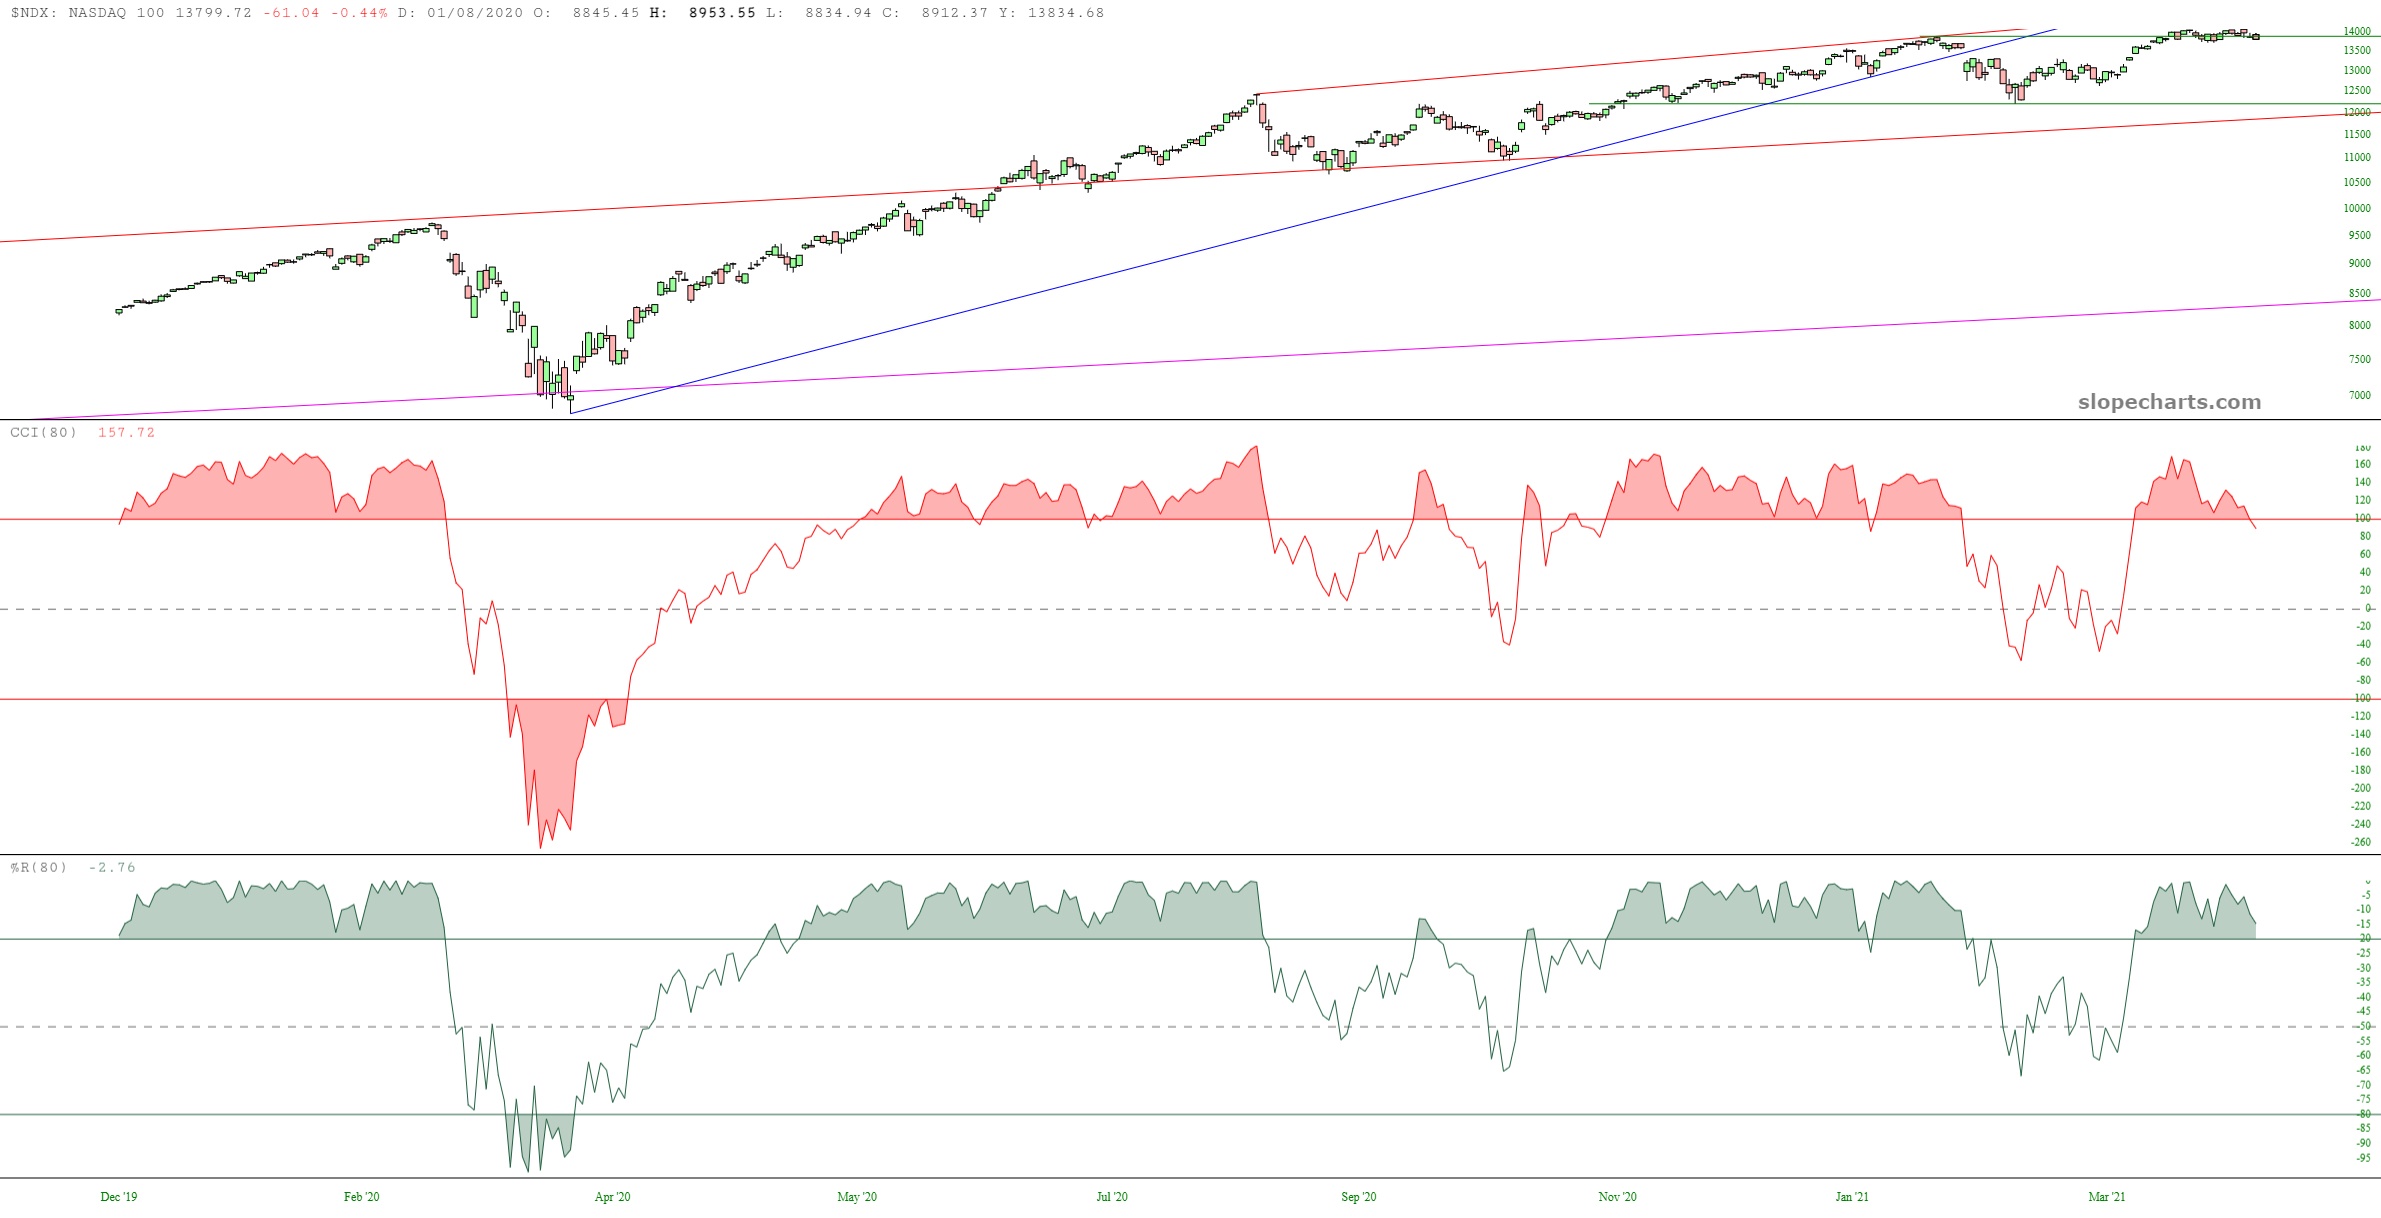
Looking at the same index, with a lot more data, augmented with some overbought/oversold indicators, you can likewise see how an important failure point is about to be breached on both the %R and CCI (which, let’s face it, are virtually mirror images of each other anyway).
Just to drive the point home, here are the same indicators, but this time with the NASDAQ Composite instead of the 100. (As a reminder, clicking on any of these graphics make a screen-filling large version appear).

