
I’m pleased to announce new tools in SlopeCharts: the Quadratic Curve and the Cubic Curve. These are both drawn objects which can be made available via the drawn objects palette.
It’s easier to show you these things than to describe them. Here is the quadratic curve, which you can create by clicking two anchor points and then clicking a third anchor point between them to stretch the curve to your liking.

The cubic curve calls for four anchor points; two at the extremes, one at the first curve point, and another at the final curve point. This is appropriate for sine-wave type drawings.

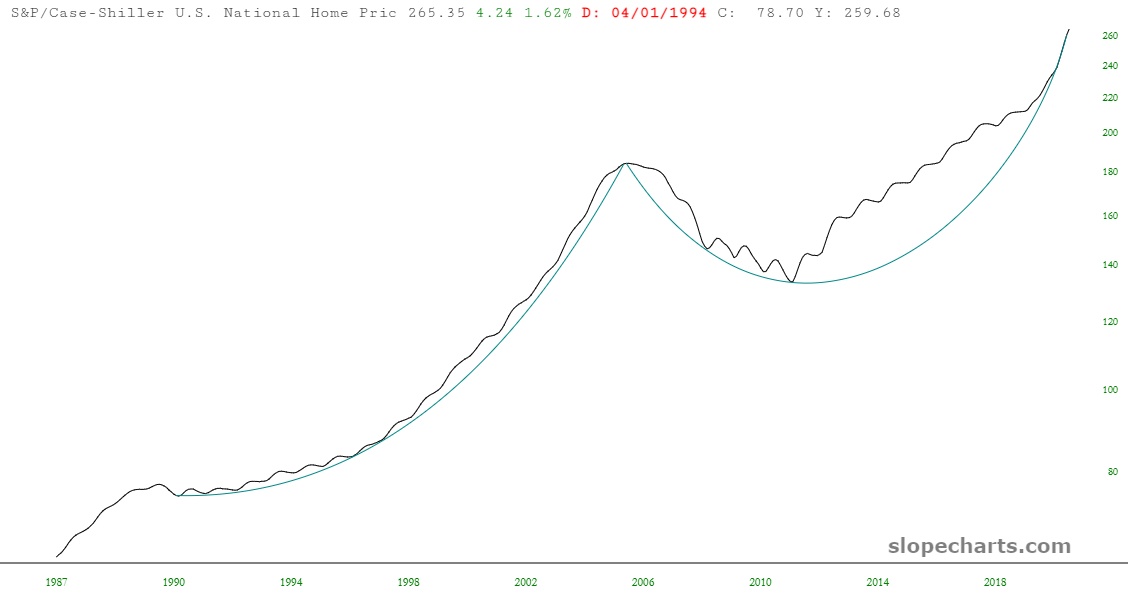
Below, for example, I have applied two quadratic curves to the chart of housing prices in the United States. Pretty cool, huh?
Here, let’s celebrate:
