(Note: this was originally intended as a premium post, and it still mainly is, since the “news” is for the Gold and Platinum members who have access to commodities data in SlopeCharts. However, I am opening this post up to all readers, simply to share the gallery of static futures charts with everyone).
Greetings, beloved Gold and Platinum members. I’ve got bad news, and good news, and better news for you.
- The bad news: Maybe “bad’ is overstating is, since, as Norm might say, it’s more of a comment, really: until now, a few of the futures were drawing data from non-standard exchanges, which frankly led to some weird price data. The shapes of the charts was accurate, but the prices were different (as if they were priced in another currency). The biggest example of this is Gold, and some of you have written, wondering why the gold chart looks good but the latest price is something like $200.
- The good news: This entire issue has been fixed! Not only is the shape of the chart proper now, but – holy of holies – the price data actually makes sense, too. Huzzah!
- The better news: Presently, the quantity of futures data is quite modest. This month, we will be expanding this data by an order of magnitude. I’ll also be updating the interface in SlopeCharts to better organize the data and make it easy to access. So………good things are on their way!
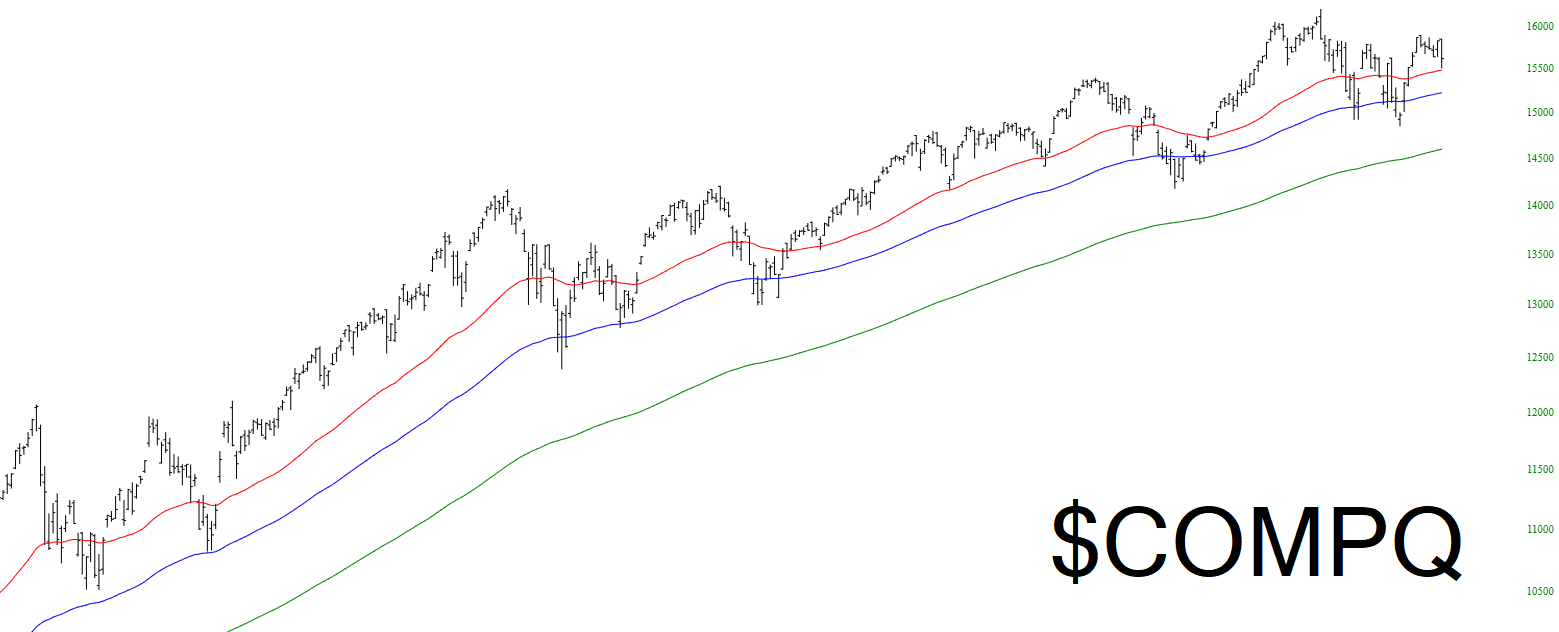
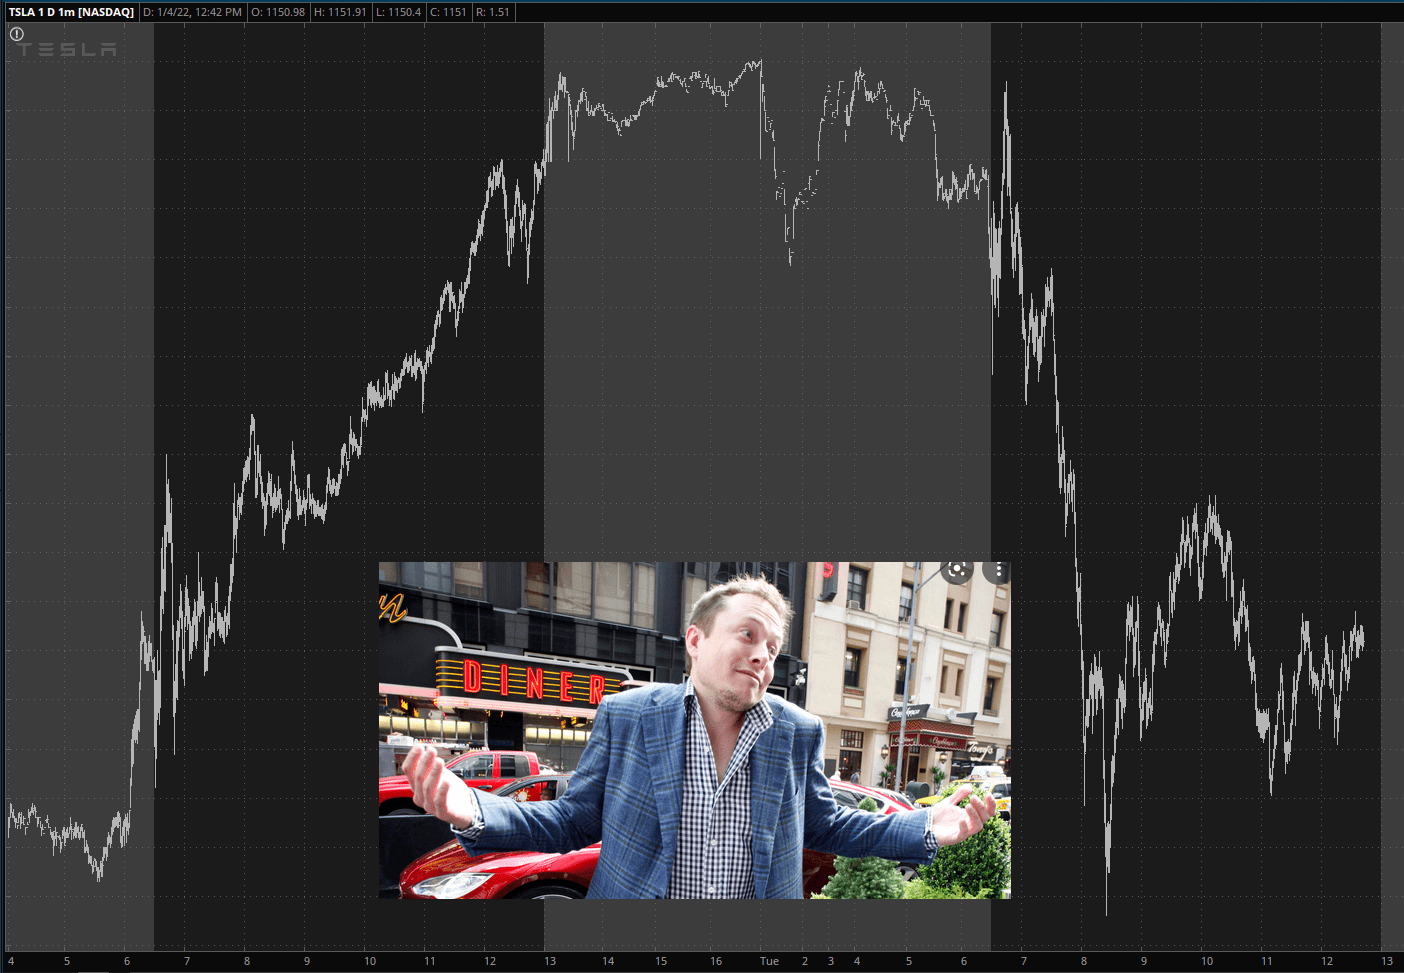
Here, then, for your viewing pleasure, are the futures available now, with a few mark-ups by me:
(more…)