
My approach to trading is verystraightforward. I mostly focus on Trendlines, Exponential Moving Averages, Candlestick patterns, and Fibonacci Retracement Levels. There are a lot of other technical trading tools out there, but I find that some are overly complex for my mind and/or designed more for the extreme analytical minded-traders, so I stay away from those and just use what works for me. I wanted to write specifically about Fibonacci levels as they can be a useful tool in identifying some interesting spots to watch in your trades.
I won’t go into detail trying to explain how Fibonacci levels are calculated or anything like that (Other websites can go into the calculation and theory, see link below*). I just want to jump into how I use them, though I will add the caveat that like all technical indicators, Fibonacci levels at times may seem like great predictors or they may not end up meaning anything. You have to watch the price action at these levels to interpret them. I usually wait for a few confirmations that the levels seem to be working before relying on them in a particular range.
The goal of my using Fibonacci retracement levels is to estimate natural levels at which support or resistance after extreme moves have occurred or if I see a range developing. I mainly set these up after long sustained moves or quick sudden large moves. There are two types of trades I look to enter when using retracement levels. The first is continuation or reversal trade on the same timeframe as which I set up the Fibonacci range. The second is to use longer term time frame Fibonacci levels to get into shorter term trades (see example 3), like quick swing trades or even day trades.
My first example is SPX with the Fib lines drawn from the January highs at 4820 to the low January 24 at 4222. My reason for drawing these fib lines here is due to 3 reasons. First, after seemingly shaking off the worst inflation numbers in 40 years in November/December, we have a failed breakout in early January (1), bearish signal. Then, we got a breakdown below a short-term trendline on January 18 (2). Finally, we see a bounce break back above short-term resistance on January 31 (spot 3, green bar back up to 4500). What these three points are telling me is that we just saw a flip in sentiment, but we found initial support on January 24. We have a potential range that we need to consider.

Now that I had my range set up, we can see the various Fibonacci retracement levels at 61.8% (4593), 50% (4522), 38.2% (4451), and 23.6% (4363). The 50% retracement meant nothing in that first week of February, but that 61.8% was almost perfectly touched and successfully pulled back (4). The nimble traders may have noticed the 61.8% retracement level held intraday at spot 4 and gotten short. This was also almost exactly under 4600, psychological big round number.
I would note that stepping in front of this train can be profitable, but also a little dangerous (see example 2 on weekly chart bounce). The pullback from this level also very cleanly touched the 38.2% retracement level on February 4 (spot 5, which also coincided with two other technical indicators). For longer term trades, you could have done what I did and wait to watch the action within these range levels to resolve themselves. Remember, at the time we were still coming off of the peak of an incredibly long bull run. That support at spot 5 could have sent us right back to all-time highs.
The next test up at the 61.8% at spot 6 on February 9 is where I took notice. I entered my short after this successfully pulled back below the 50% retracement level as this was a failure to breakout and a failure to hold that important psychological level. You can see also a subsequent bounce at the 23.6% level into the 38.2% level before resuming the downtrend (again, short-term traders likely took advantage of these levels as well). With the break below the January low in February, this range was officially broken and you can probably ignore these levels going forward. Once the range is broken, I delete the Fibonacci levels as they don’t mean anything anymore at these levels.
After the January Lows broke, I expanded the Fibonacci range levels to the February lows:
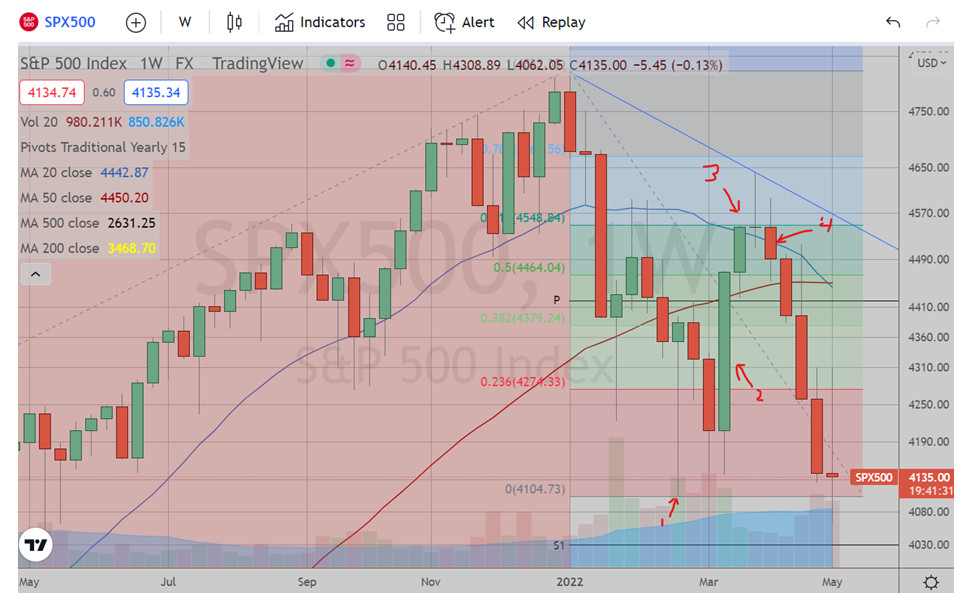
Like with the daily chart, I did not draw a new range to the bottom at spot 1 until I saw the very large green engulfing candle on the weekly chart at spot 2, indicating possible reversal. Once I drew the Fibonacci range, I watched the very picture-perfect weekly close for the week of March 21 at spot 3. I’m sure a lot of traders tried to call a turnaround at the end of that week.
But the week of March 28 seemed to try following through with the bullish reversal and hurt a lot of bearish traders. Then something interesting happened. The peak of that week is a bit innocuous (as they often are), nobody would have looked at 4640 and declared that a reasonable reversal peak. I know I didn’t. But it was the price action that caught my interest as it successfully closed that week back below the 61.8% retracement level.
This action, combined with the bearish shooting star candlestick pattern, told me to again watch the following week price action for bearish trades. The first full week of April attempted a move higher the next Monday April 4 but immediately reversed the following day. Once I saw the break below the prior week low at spot 4, I got very bearish again. You can see the following weeks respected these levels as well trying to find support at the 38.2% level.
Using this past week and different time frame as another example, here is SPX on an hourly chart:
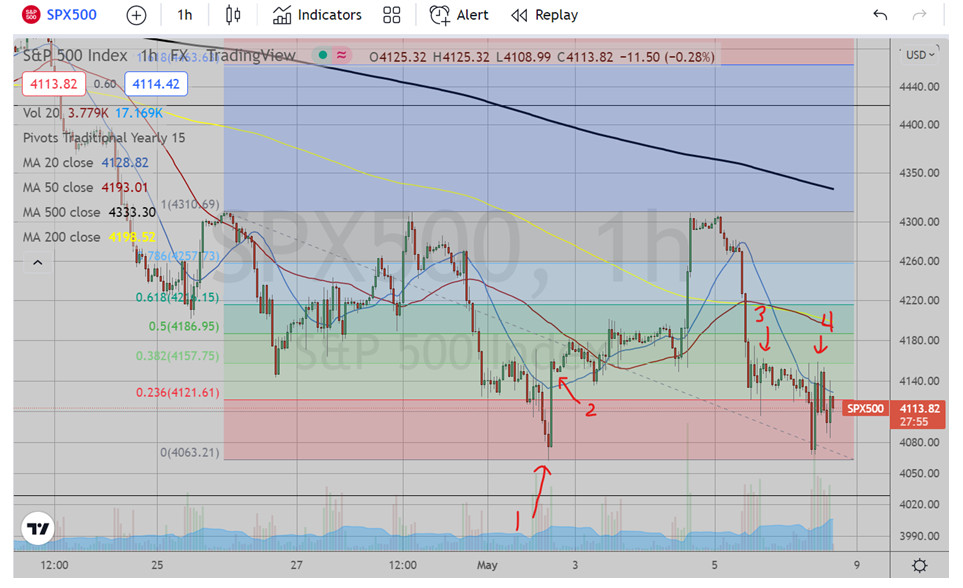
I’ll just note that I didn’t trade this, but I was watching it and am just going to comment on the action and the tradeable movements. This is obviously a much shorter time frame compared to the last two examples and lends itself more to day trading than swing trading. I drew the fib line range from the top of this range at 4300 on 4/25 to the bottom at 4063 on 5/2 (spot 1). I didn’t actually draw this range until I saw the strong green candle engulfing at spot 2.
At this point, that 50% retracement obviously saw some action leading up to the FOMC decision and day traders could have taken advantage of the choppy movement back down to the 38.2% level. Catching the pop back up to the top of the range was also possible for those nimble traders (though I would not have seen that move coming). But I found the action at spots 3 and 4 the most interesting. A lot of the action at spot 3 was overnight futures trading, but it held within a very tight range between the 23.6% retracement at 4121 and 38.2% retracement at 4157.
Then it was slowly bleeding downward into the day’s open at 9:30 for a nice big red candle to the fib range low when the market opened. The low end of the range obviously didn’t break. When a range holds like this I start to look back at the retracement levels again. The 23.6% retracement failed to hold, but the 38.2% at spot 4 held fast, making good as a scalping opportunity on this short time frame. Looking forward, until this range breaks downward or upward I’d be watching these fib levels for consolidating action. Again, I’m not day trading this but merely watching the action at this point.
So, these are just a few examples of how I have recently used Fibonacci levels for purposes of my trading. While they may be used as technical indicators on their own, I find they work best in concert with other indicators to get the full story the market is trying to tell me. I’m sure you can find examples of them working great as well as other examples of them not working at all. As I said above, I would wait for some confirmation that the levels are working first before I jump headfirst into trades. But at the very least, they can help in setting your risk reward ratios when looking at these potential support/resistance levels.
* Fibonacci retracement levels and Fibonacci ratios explained (aplusforex.com)
