
For those with bearish proclivities, it has been a rough stint since October 13. If nothing else has been gleaned from the past 11 months, I think we can all agree that forecasting market moves based purely off what we believe the overlying macro environment is has not been consistently working. The goal here is to provide some context around these moves – especially the latest – and frame it with forward looking data that may help guide us to short term market potential.
First, let’s identify the things that we do know. Top of mind: 1) We are still in a Quantitative Tightening regime, 2) This Friday is a Monthly OpEx, 3) Since the all time high, we have tagged the downwards trendline (orange dotted line on Figure 1) acting as resistance two times – in March and August.
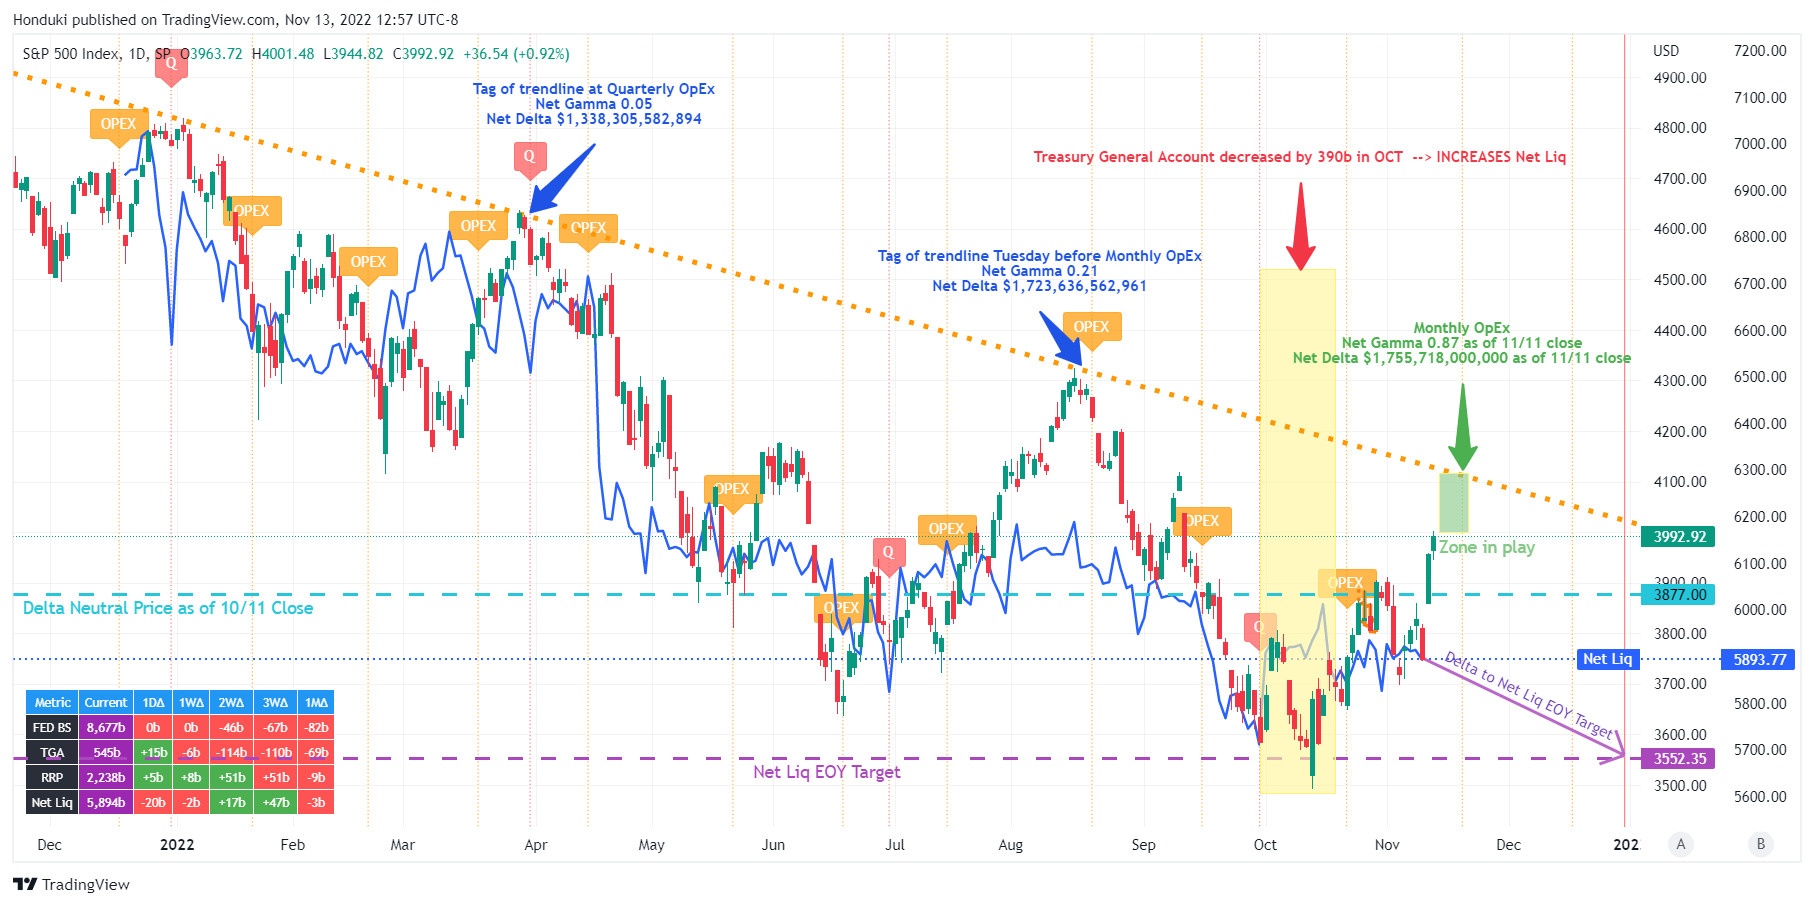
Figure 1: SPX vs Net Liquidity
Quantitative Tightening cycle:
On Figure 1, the blue line represents market Net Liquidity, defined by: (Fed Balance Sheet) – (Treasury General Account) – (Reverse Repo). There is a table in the bottom left that identifies changes in each over the last day, 1 week, 2 weeks, 3 weeks, and month (data as of 11/11).
The Fed’s stated targets for balance sheet reduction are the following:
- For Treasury securities:
- From June – August, cap was $30b per month
- Starting in September, that was raised to $60b per month
- For Mortgage Backed Securities:
- From June – August, cap was $17.5b per month
- Starting in September, that was raised to $35b per month
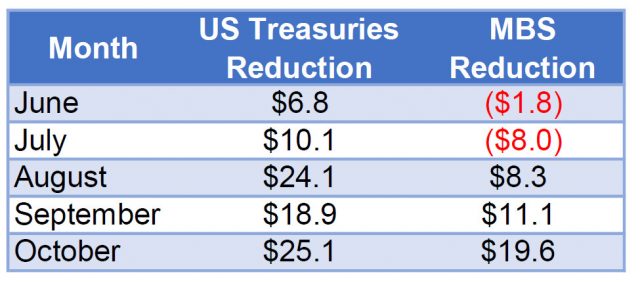
So how has the Fed been executing against these targets? High level, you can see the trend from the FRED charts below (Figure 2 and Figure 3). To get more granular, see Figure 4 for a view of how woefully short of their targets the Fed has managed to achieve.
Figure 2: Federal Reserve, US Treasury Securities
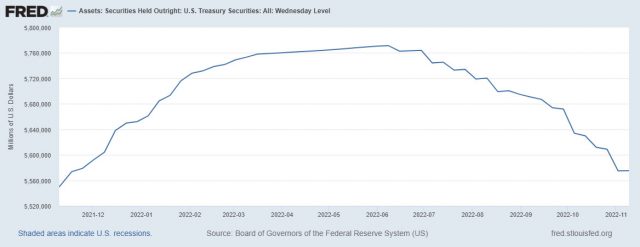
Figure 3: Federal Reserve, Mortgage Backed Securities
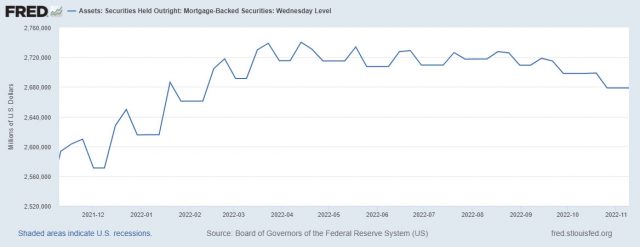
Figure 4: Federal Reserve Balance Sheet Reductions, June — September
We know that reducing Net Liquidity has a direct negative impact upon the market, and inversely loosening of conditions has a positive impact. As Tim has pointed out for months now, there is typically a lag of approximately a couple of weeks before the market feels that effect and reacts accordingly. Practical examples from Figure 1:
- Net Liquidity updraft starting in late February, which resulted in the March equities rally
- Net Liquidity updraft in late June, which preceded the August rally
We hit a low Net Liquidity for this cycle on September 30. Rather unexpectedly, US Treasury data for October shows going from a $430b deficit in September to a $89b deficit in October (resulting in TGA balance going down). The impact was a positive drift upwards in Net Liquidity in October. In hindsight – the subsequent rally we are experiencing in equities is rather expected.
Looking forward – in the US Treasury’s 10/31 Financing Estimates: 2022 – 4th Quarter release, Yellen guides to TGA of $700b by end of December 2022. That – even with VERY conservative estimates for monthly Fed Balance Sheet roll off for November and December – gives an End of Year Net Liquidity target of ~ $5,680b, which is below the low point this YTD on September 30.
The Entire Picture
Now that we have the complicated liquidity background contextualized, let’s look at all the consistent data points since January. Everything below refers back to Figure 1.
- The prior two rallies this year have coincided with periods of Net Liquidity increase
- The prior tags of the downward trendline from the ATH corresponded with OpEX events (blue arrows on Figure 1). One of the tags (August 16) occurred Tuesday the week of expiration.
- Net Liquidity will be decreasing significantly from now until the end of December – reaching a low point for the year. This in the past has consistently had a negative impact upon equities, albeit typically with a 2-3 week lag
Putting all this together, the following assumptions are reasonable:
- The current rally was fueled by excess liquidity injection over the month of October. Per prior two positive liquidity events this year, a tag of the long term down trendline this week of OpEx should be anticipated
- Since liquidity is beginning to decrease and the Treasury has guided to significant tightening by the end of the year, this rally end is likely to coincide with a tag of the long term trendline and OpEx week (“Zone in Play” green rectangle on Figure 1)
- Going into OpEx on Friday positioning is set for price stability this week. Delta neutral price is SPX 3877 as of 11/11 close and with SPX closing at 3992 on Friday, options vanna (IV decline)and charm (time decay) are most likely to continue to support markets into 11/18 expiration.
- After OpEx – with the above conditions in place – we will likely see a cooling of the rally
Risks:
- This week: Crypto liquidation accelerates; Retail earnings severely disappoint
- US Treasury does not bring TGA to $700b until the VERY end of December. Look at last year – they made massive reductions beginning on December 27
- If this were the case, markets could continue to be supportive through the end of the year, and blow through long term trendline. I would expect to see continued rotation out of overbought (>200ma) sectors/equities and into the severely oversold ones – at a very broad scale, NASDAQ outperforming Dow as we saw late last week. Purely time and price, not macro. We have seen these cyclical rotations countless times this year
If you use TradingView, you should be able to access the Figure 1 chart here.
