
I know I’ve voiced my disdain for Bitcoin on a Fundamental level. This is neither here nor there, however, as I have been skeptical of this since it was valued at $200 per coin and I was obviously proven wrong (so far). Regardless, I’m a chartist at heart. Just pointing out what I see in the short term.
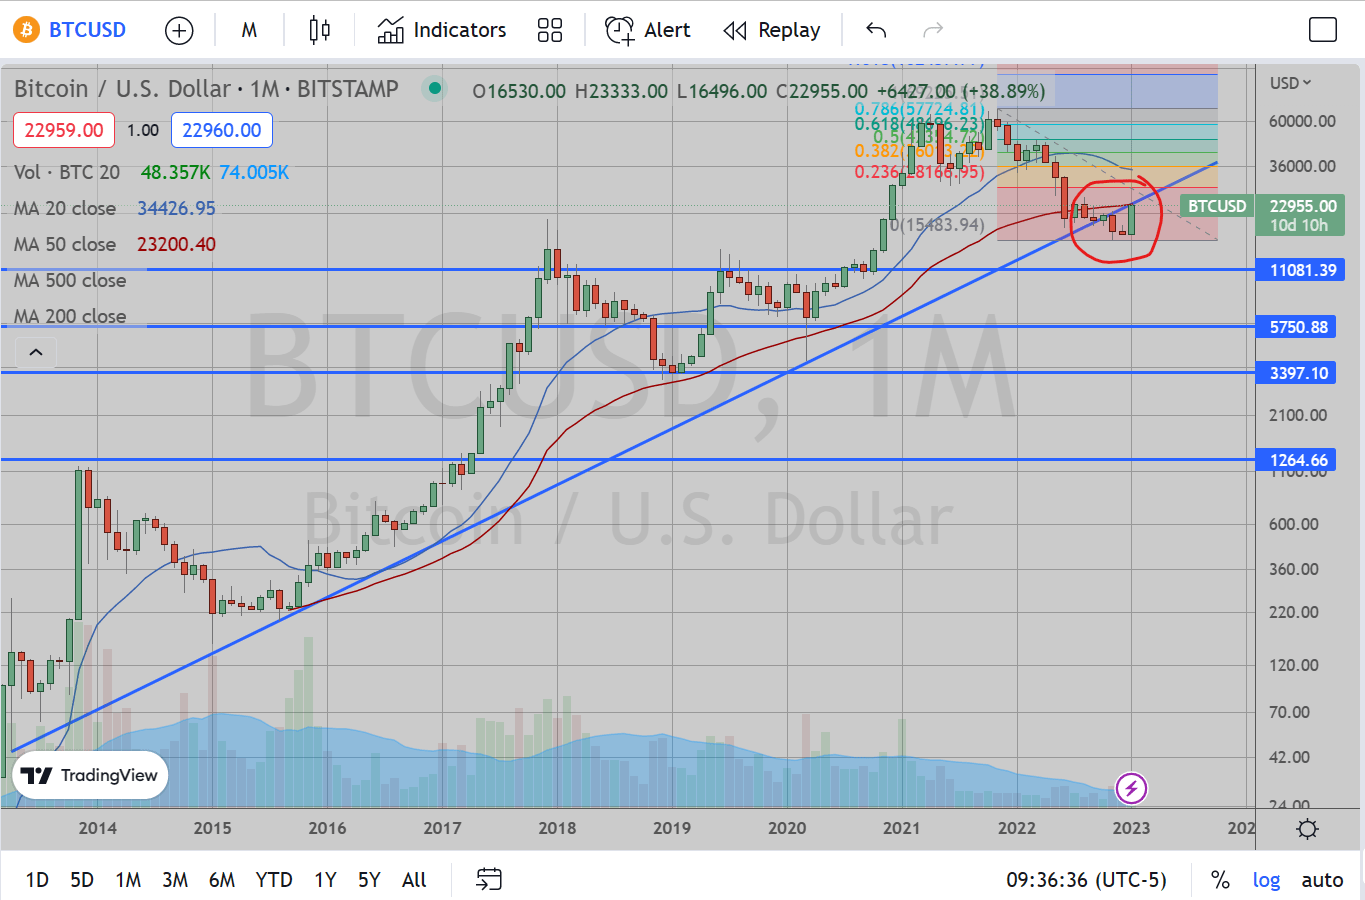
Monthly Chart here shows the trendline this has obediently followed since 2013. It broke beneath it in November 2022. However, this newfound strength is jamming it back up to retest this trendline from underneath. I find this is usually good for an immediate short-term trade. Longer term speculation remains hazy however.
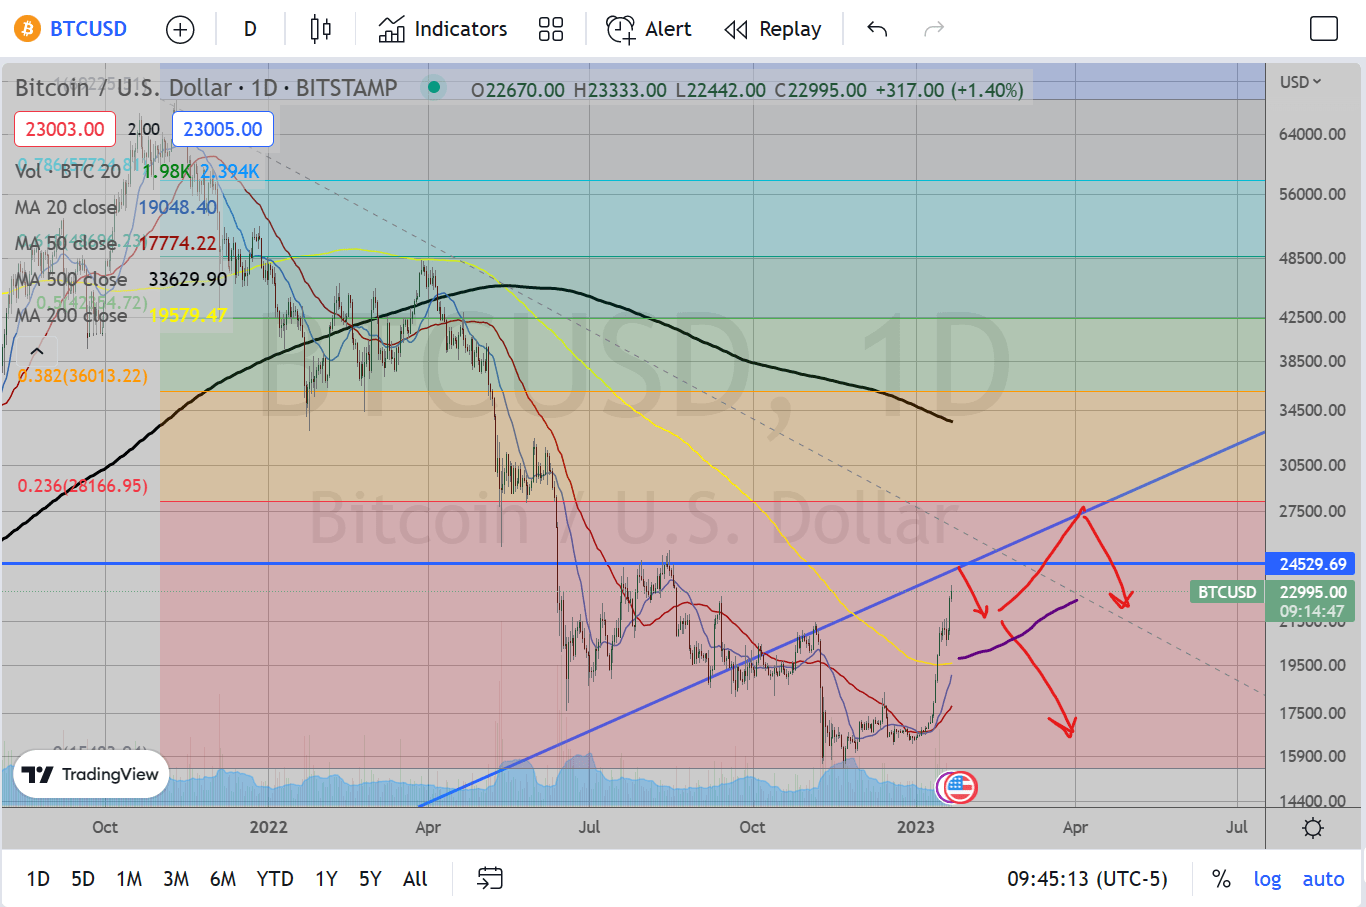
The Daily chart shows the important levels to watch. I think this has at most about 1k left in the tank to reach $24,000 (I am writing this as of Saturday morning, so prices may change from here), though it could slow down even here at $23,000. I think a pullback from here is very probable to at least $21,500, possibly to $20,000. With the way this thing moves, that retest could happen in a matter of hours or weeks, who knows. But I think the combination of the retest from underneath the broken long term trendline combined with the previous August resistance area of 24,000-25,000 should provide a nice risk:reward short here (if there is an way to short bitcoin, I really can’t say. Perhaps futures?). However, this prognostication only serves a very short-term view.
Beyond the retest of 21,500, I think there is a strong change for a bounce back up to retest this trendline yet again. There is always a chance at a reversal failure but this recent upward move has broken above the 200 Day EMA, which this had previously respected as resistance since December 2021 until now. As such, I expect this to at least attempt to become a supportive moving average. Should this bounce come to pass, then BTCUSD has a chance at another hard bounce up to $27k-$28k which would be my target due to the previous support in May 2022 and the trendline lining up with the Fibonacci 23.6% Retracement Level (Fib Lines Drawn from all-time peak to November low at $15,800).
To summarize, my longer-term outlook is still very bearish. When something has followed a technical indicator like a trendline or Moving Average for that long (10 years in this case) and it breaks then I expect it to act very harshly in rejecting any attempts to ignore the break. I.e., we should see very quick resistance each time it tries to retest under that trendline.
In the short-term, I think we have a very good shot at resistance between $23k-$24k and a reversal to $21k area, followed by a strong chance for a bounce from there up to $27k with the trendline and Fibonacci levels to act as continued resistance. Medium-term outlook is a crapshoot. When breaking beneath and retesting ascending trendlines, the action is kind of annoying and difficult to play as this could continue higher and still remain within the technical definition of “resistance”, but already the potential for $28k means a 16% higher move from current levels, or a 33% higher move than the $21k level where I think we could bounce. So best of luck to all if trading Crypto/Bitcoin. I think there is plenty of action for both sides in the coming weeks.
