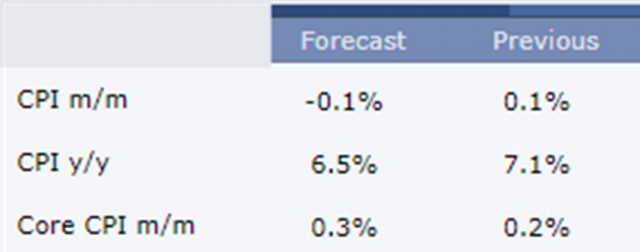
There are obviously thousands of possible outcomes to the equity markets following Thursday morning’s pre-market CPI release, but I wanted to sketch out three of them just to muse on the topic. There’s not a doubt in my mind that Thursday January 12th will be the most important and exciting trading day of the year so far. All three of these charts are of the S&P 500 /ES equity futures market. Here’s the first:
The above would be a healthy move for the bulls. That is to say, a modest diminishment (perhaps overnight), a strong rally following the CPI release, a subsequent drop erasing most or all of the ascent, but not going beneath the start of the ascent, and then finally a push higher, creating a new multi-week high. This would be a non-crazy, constructive, sustainable move.
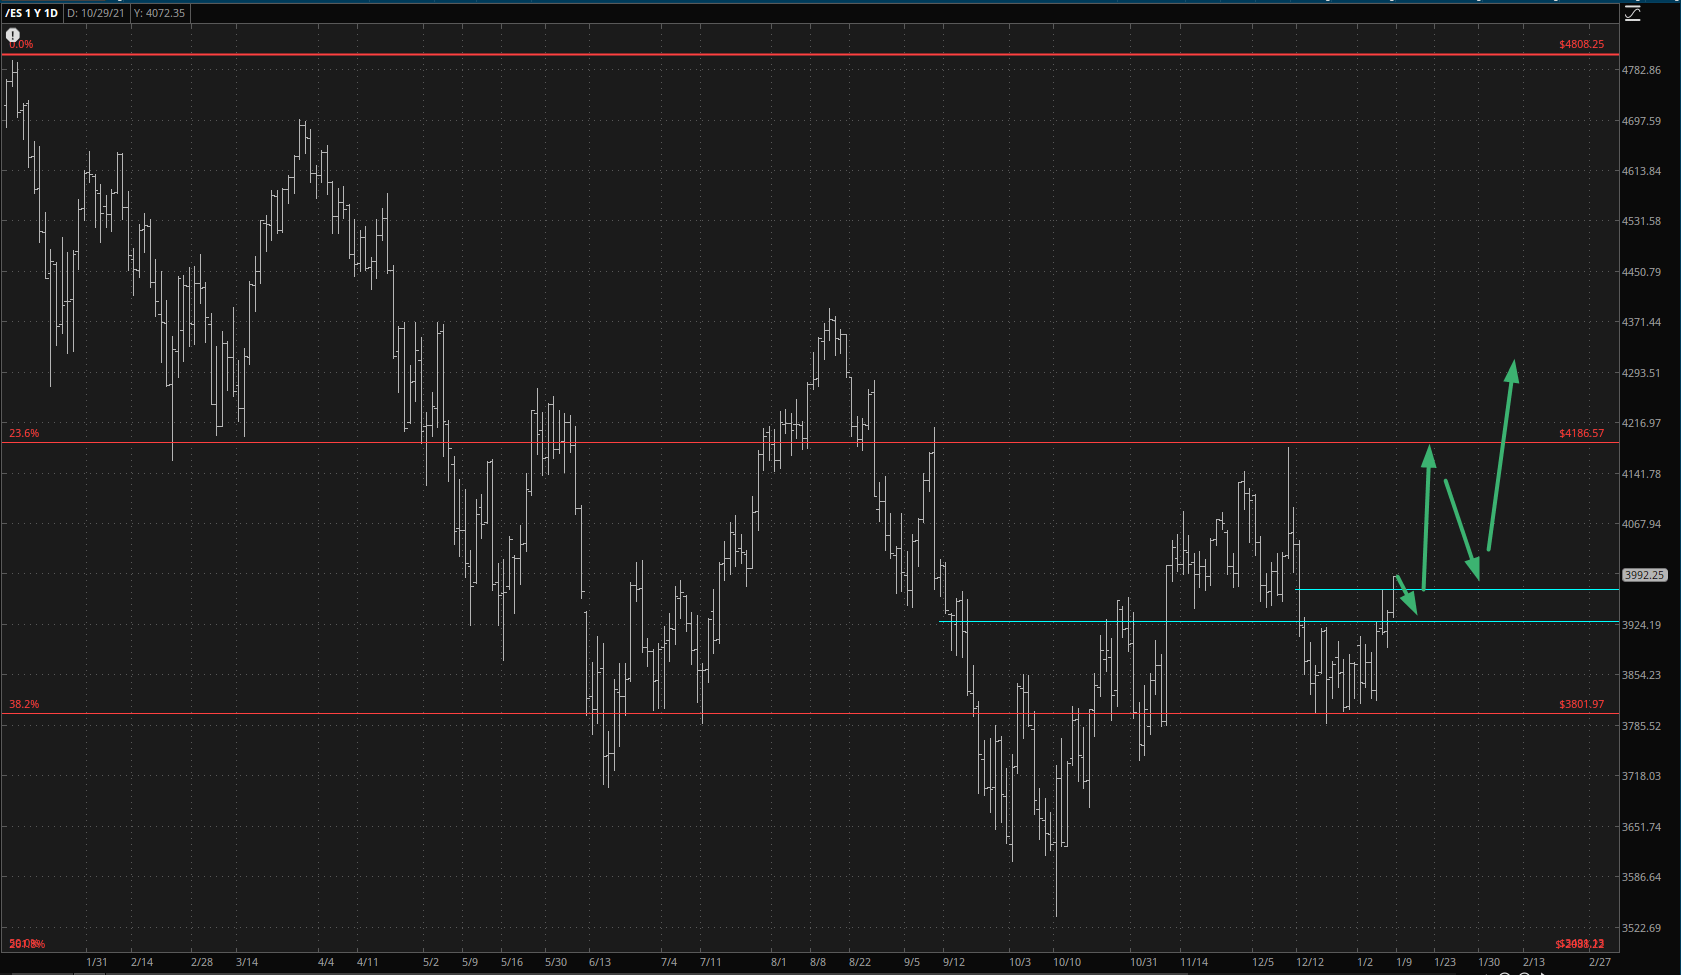
The supercharged version of this would be more like the graph below……..
In this case, the move is so strong that it blows right past the most recent “lower high”, retraces a bit, and then goes roaring toward the peak made on December 13th. By no means am I suggesting such a move would all take place inside one day, but this would be the general path over a period of days.
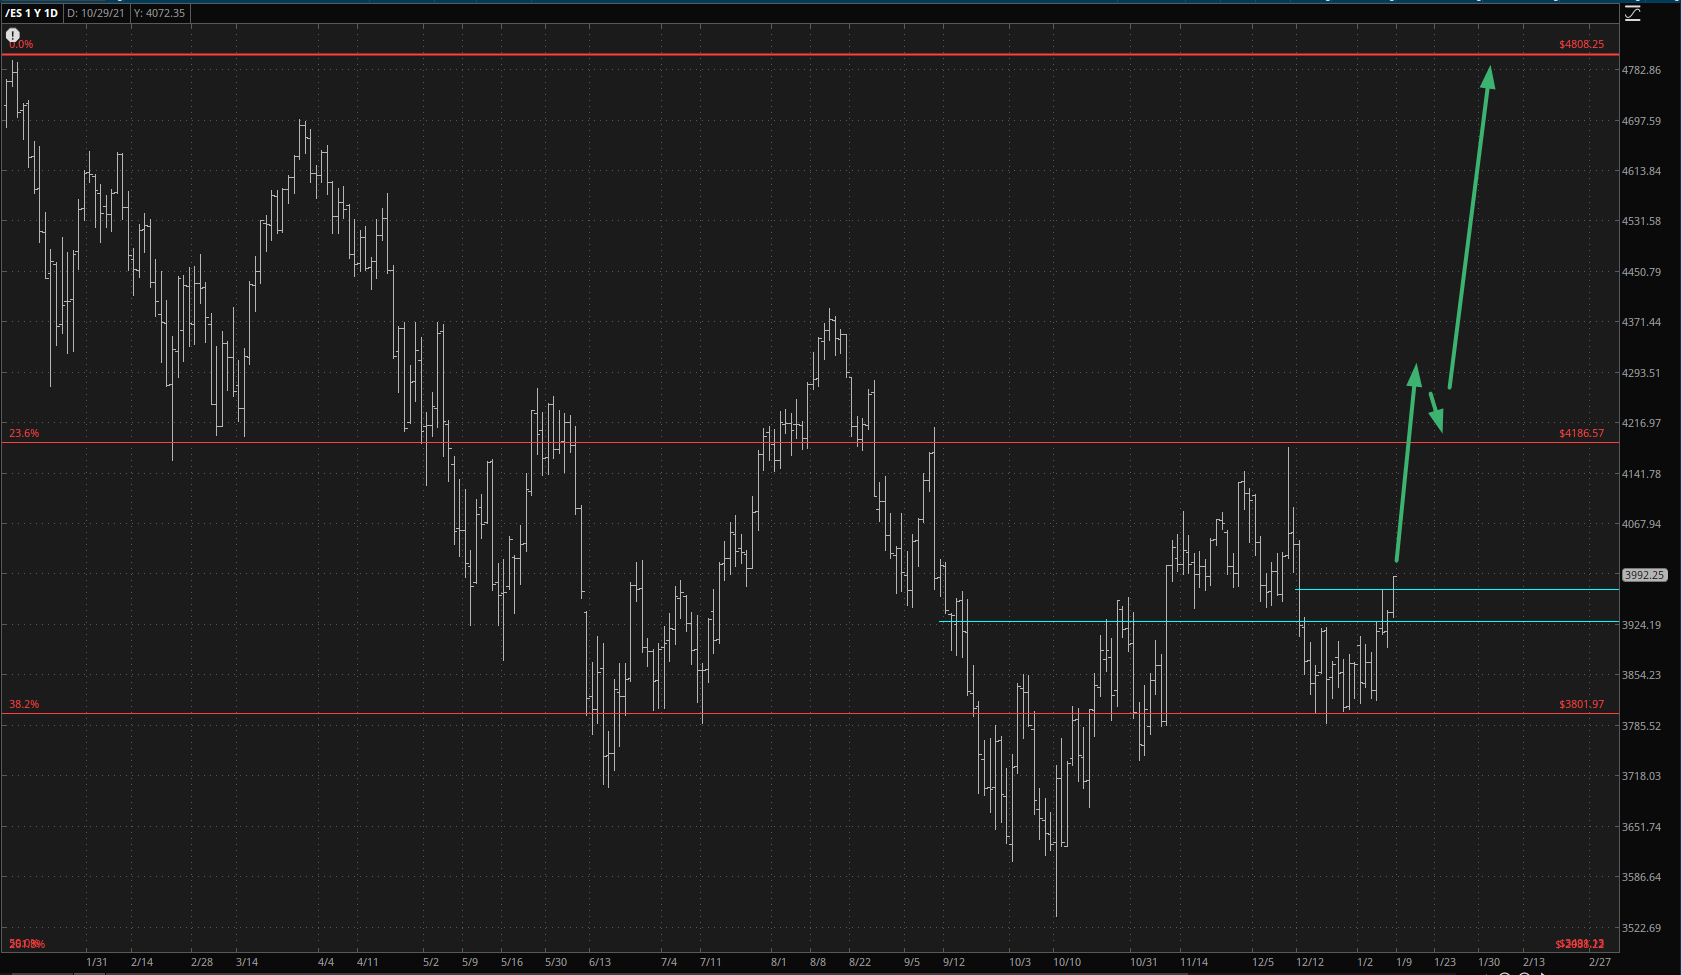
And here, for my fellow bears out there, is a more appealing possibility:
In this case, yes, we get a strong move following the CPI but, just like on December 13th, the gains are reversed. It tries to rally again, but it doesn’t even make it to the morning’s high, at which time it starts falling again and actually ends the day in the red.
The best of both worlds for the bears would be a “bullish’ CPI number (that is, inflation is weak and falling) only to see equities lose ground. This would clearly demonstrate that the bulls had gotten way ahead of themselves and overpaid for what they perceive as a Goldilocks scenario.
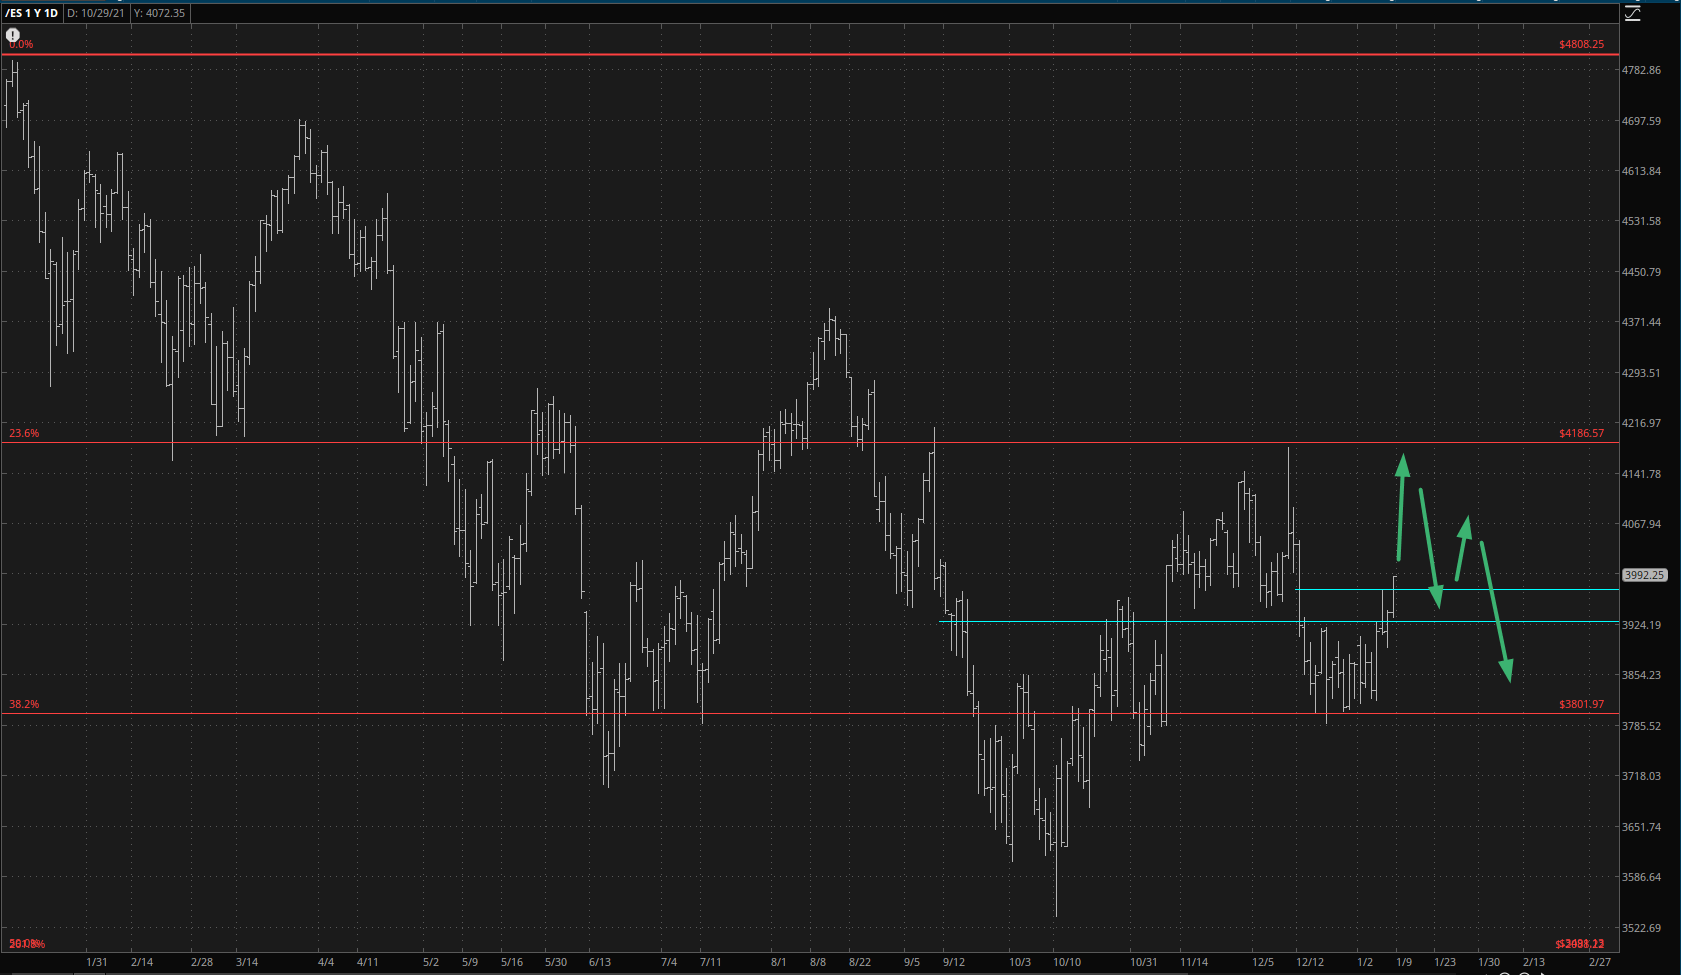
Here, by the way, are the key figures for Thursday morning’s widely-anticipated CPI: