I was talking on Friday and Monday about the likely topping process now in progress on SPX here, and the possibility that SPX would head down into the possible H&S neckline in the 4070 area, supported by the daily RSI 5 sell signal that had fixed. That target was reached yesterday, and the daily RSI 5 sell signal made and exceeded the target at the 30 level on the daily RSI 5.
SPX daily chart:
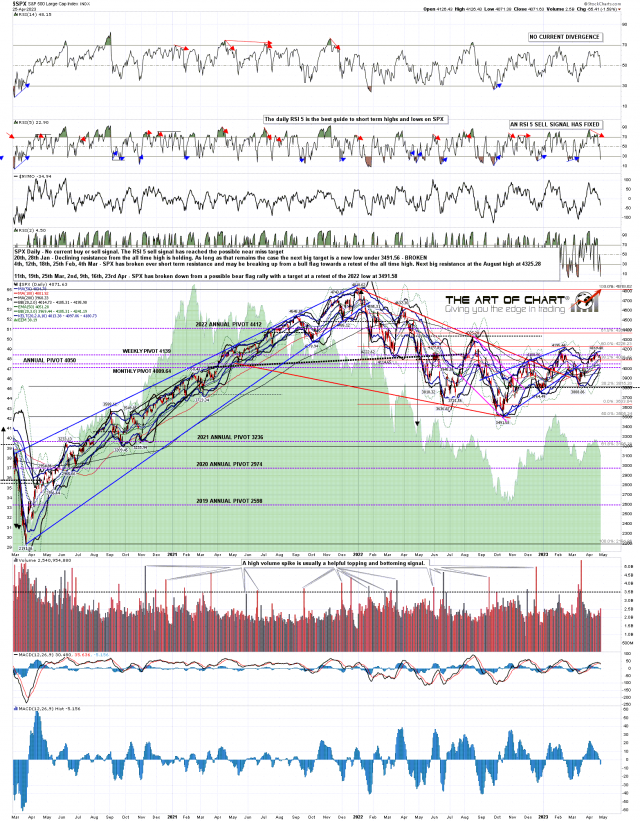
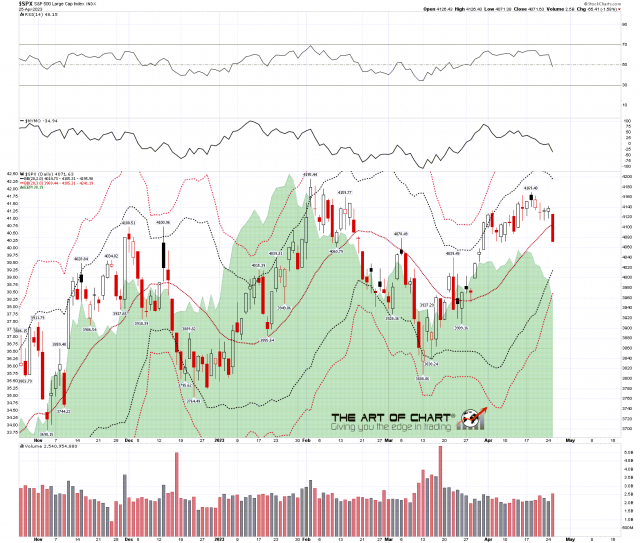
The daily middle band, now at 4105, was broken hard on that move and I’ll be watching that carefully today, as a rejection back above it today might open a retest of the current high at 4169.48. Until that happens that is closing resistance at 4105, and that may well be backtested today.
SPX daily BBs chart:
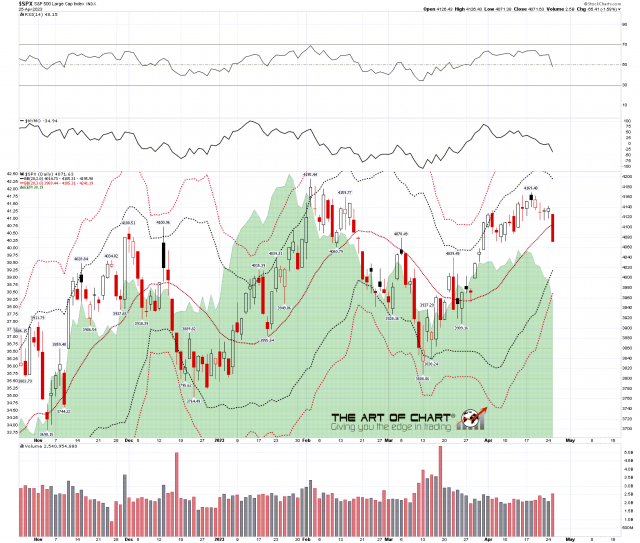
On the hourly chart the RSI 14 sell signal also reached target, and there is no hourly positive divergence, though there is on ES where yesterday’s low was retested overnight.
SPX 60min chart:
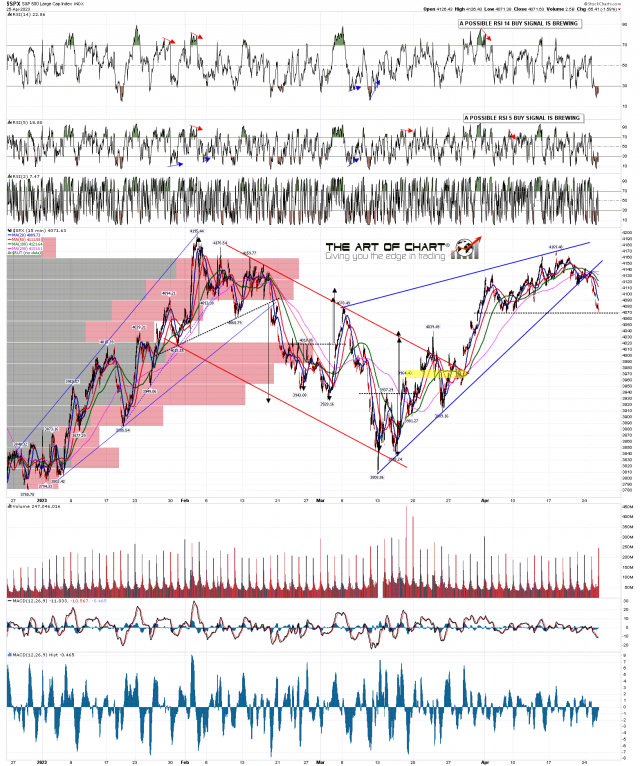
On the 15min chart you can see that the possible H&S neckline was retested perfectly at the low yesterday. If a right shoulder forms the ideal right shoulder high would be in the 4135 area.
SPX 15min chart:
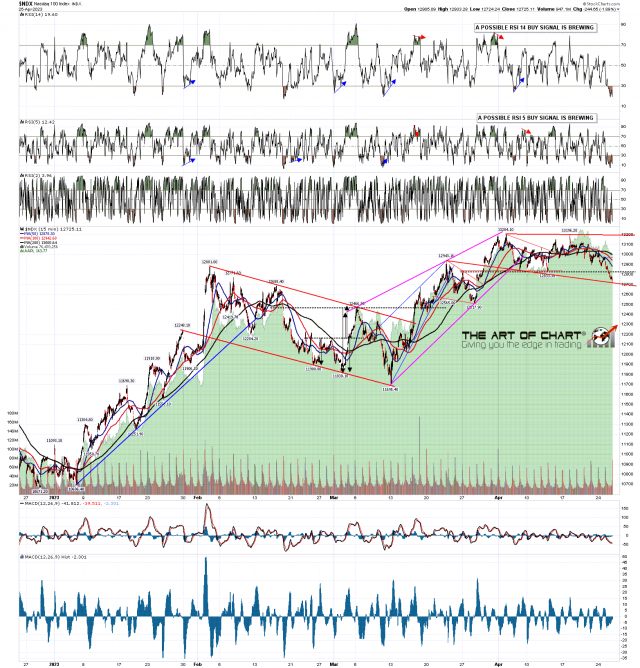
I’m watching NDX with interest here. On Friday I mentioned that there was no clear bull flag setup on NDX, but that is no longer the case, as the low yesterday established a trendline on both NQ and NDX that may well be support on a bull flag megaphone. This may mean that the 13204.10 high still needs a retest.
Something I do also see happen regularly though is where a bull flag forms and breaks down rather than up, in which case that becomes in effect a topping pattern, and that might be the case here of course.
NDX 15min chart:
In the short term I think the odds are 75%+ that SPX is topping out short term for at least a decent retracement, and I am looking for a topping pattern. Ideally here that pattern would be an H&S forming, and the next move would ideally be to rally into the 4135 area, and then fail hard into the H&S target in the 3970 area. We’ll see if this plays out that way. There are now three fixed and one brewing brewing buy signal on four of the six index futures I follow, so I’m leaning strongly towards a decent attempt at a rally today.
If you are enjoying my analysis and would like to see it every day at theartofchart.net, which I co-founded in 2015, you can register for a 30 day free trial here. It is included in the Daily Video Service, which in turn is included in the Triple Play Service.


