When I was a kid, April Fools’ Day was kind of fun, but as an adult, seriously, it’s really annoying to read every given news item and wonder if it’s a joke or not. Given the state of the world today, it’s harder than ever to tell.
Mercifully, April Fools’ Day (which follows the vastly more consequential Transgender Visibility Day, which I trust you all celebrated with verve) is just about over. Let’s look at a few index charts to catch up.
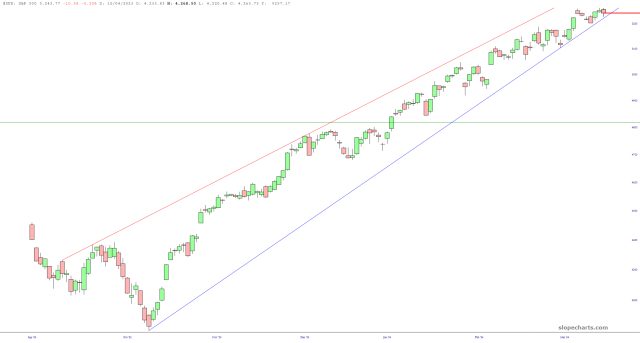
First is the S&P 500, which hasn’t violated its ascending wedge over the past half year, but goodness gracious me, it sure is getting close. One even slightly bad day which crack this sucker.

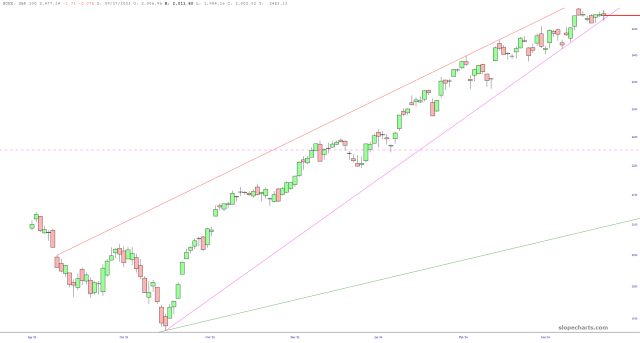
The S&P 100 is in the same situation, although a generous ursine sort could point out that it actually busted its trendline by a pixel or two today already.

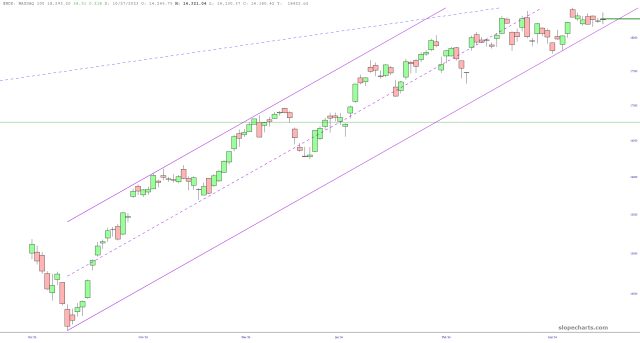
The NASDAQ 100 has been rock solid, following a parallel channel as opposed to the constantly tightening wedges shown above. Here, too, one solid red bar would crack this thing, but until the semiconductors stop pumping to lifetime highs every day, the fuel is just going to keep flowing.

Ditto for the broader NASDAQ Composite.

I tell you one thing, one of the great fake-outs of the 2024 has been energy. We were right at the cusp of completing a beautiful reversal top, but just when it was looking like it would break down, whoosh, and I do mean whoosh, it blasted into the sky. And, umm, we’re still supposed to believe inflation is 3%, right?

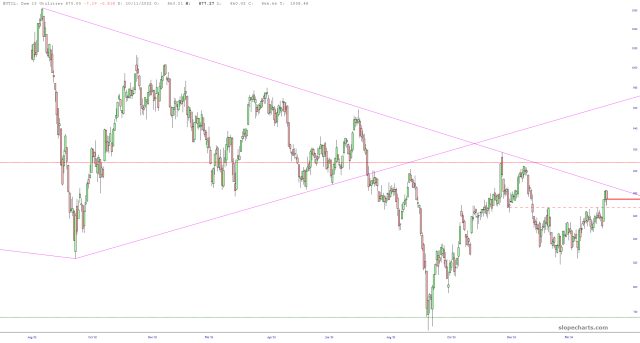
Lastly, the Dow Utilities decided to have a bit of mercy and turned lower. It continues to respect its multi-year descending trendline, and it needs to break the horizontal in order to really give the one or two bears left on the planet any it of hope.


